Disclaimer: The views expressed in this presentation are those of the author(s) and do not necessarily represent the views or policies of the U.S. Environmental Protection Agency. Mention of trade names or commercial products does not constitute endorsement or recommendation for use.
NGEM: Next Generation Emissions Monitoring FMD: Fixed Methane Detector
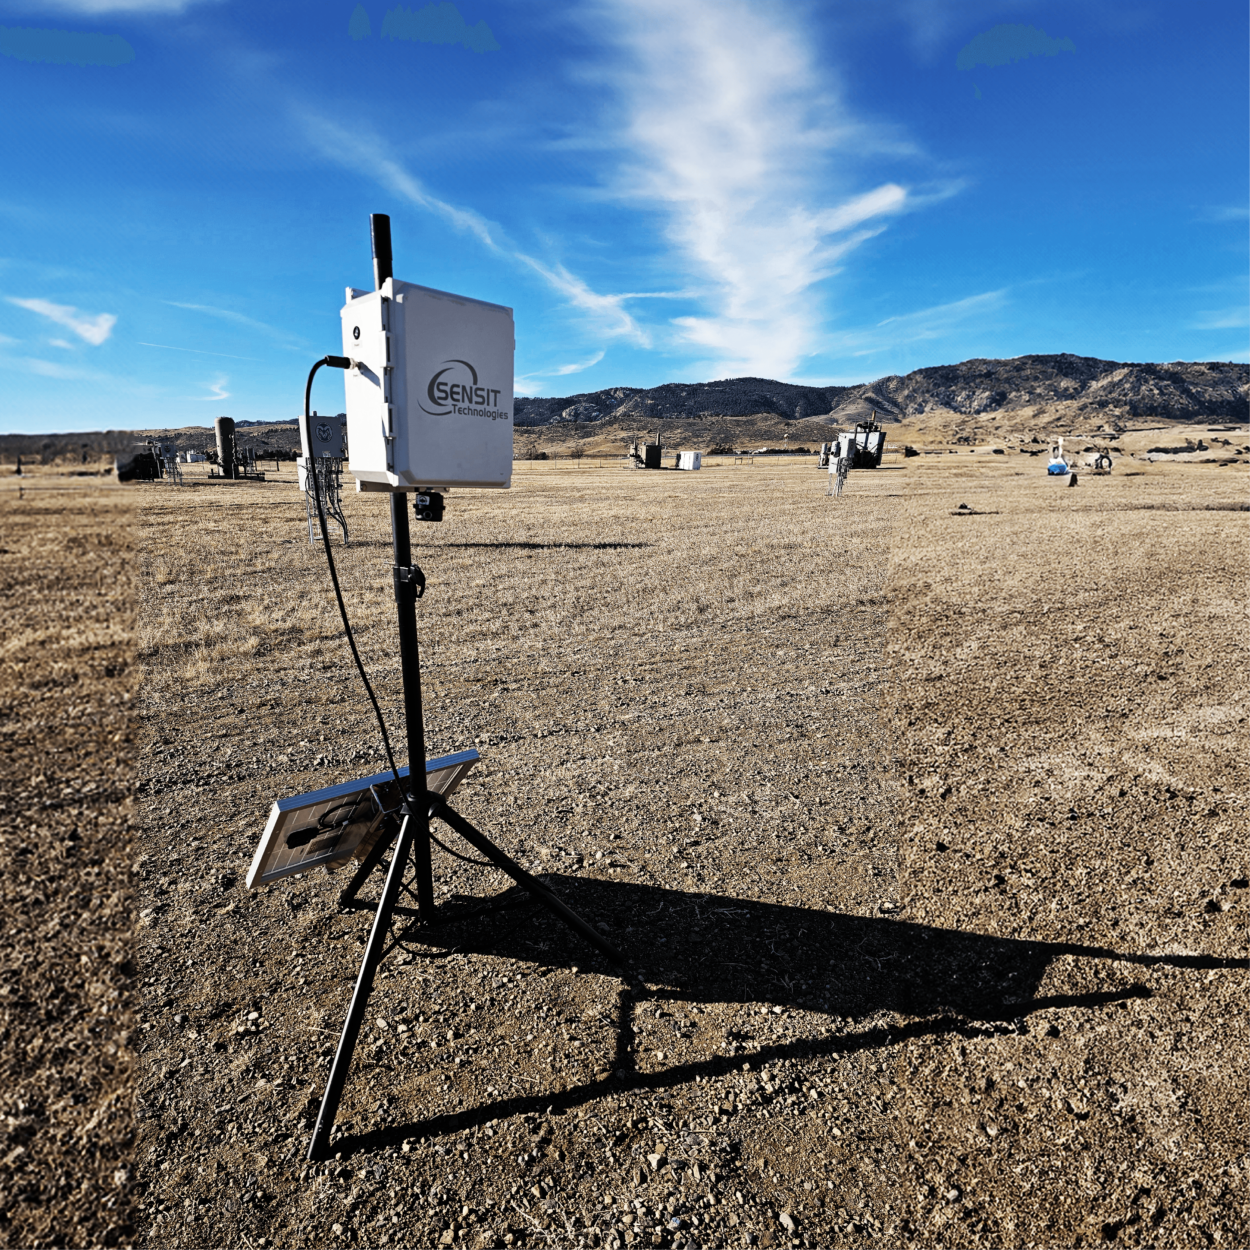
Fixed Methane Detector (FMD) Tunable Diode Laser Spectroscopy (TDLAS) system tested at U.S. EPA Test Range
Deployed 6 units at Colorado State University (CSU) Methane Emissions Technology Evaluation Center (METEC)
Acquired dataset from 6 FMD units along with information regarding calibrated releases
Approached U.S. EPA to help explore METEC data
Joint collaborative activity with open-source publishing goals. No compensation provided by U.S. EPA ORD- Others are welcomed!
SENSOR CLASS DEVELOPMENT
Understand the core capabilities and limitations of the technology
| Application | Purpose | Sensor/INSTRUMENT Needs |
| In-Process-Unit | Detect and characterize emissions |
|
| In-Community | Quantify ambient levels |
|
| Fenceline | Detect and characterize emissions |
|
In Process Unit
High concentration faster source signal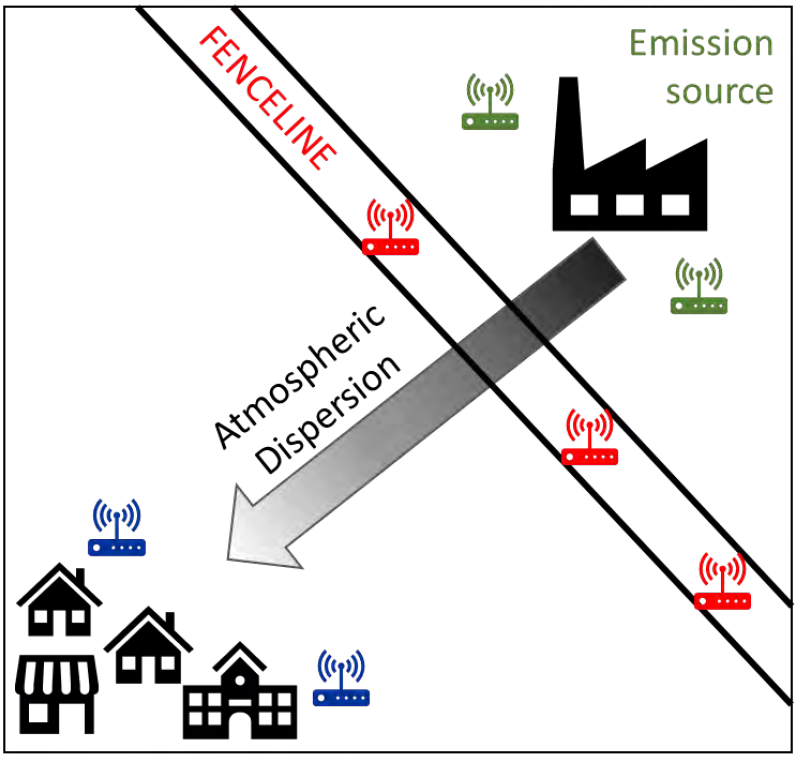
In community
Lower concentration slower source signalOPEN-SOURCE DEVELOPMENT OF METROLOGY AND ALGORITHMS
Provide model for data sharing and transparency
U.S. EPA TEST RANGE
TDLAS Operating Principal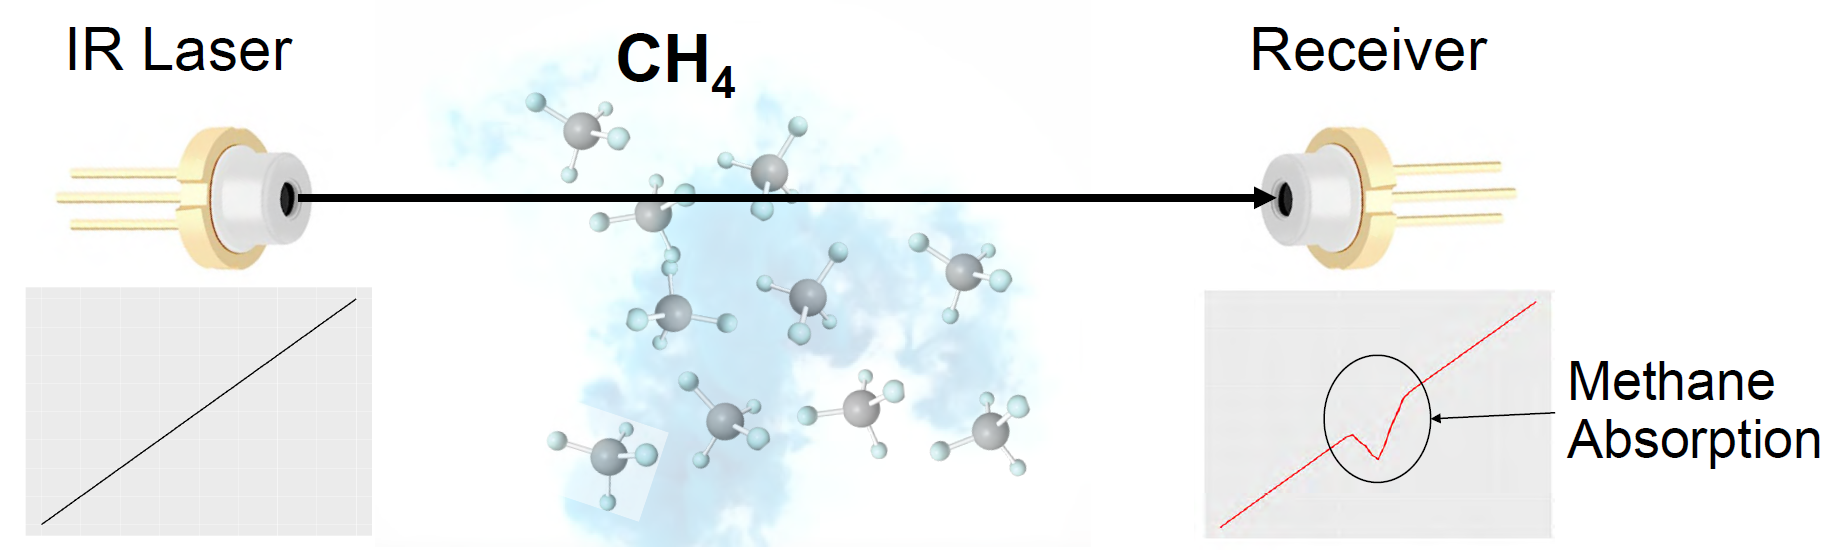
| Methane Detector Specification | |
| Technology | Near Infrared (IR) TDLAS with Multi-Pass Cell |
| Wavelength | 1650 nm |
| Range | 0-100 vol.% |
| Noise Floor | 0.3 Part Per Million (PPM) |
| T90 | 10 seconds |
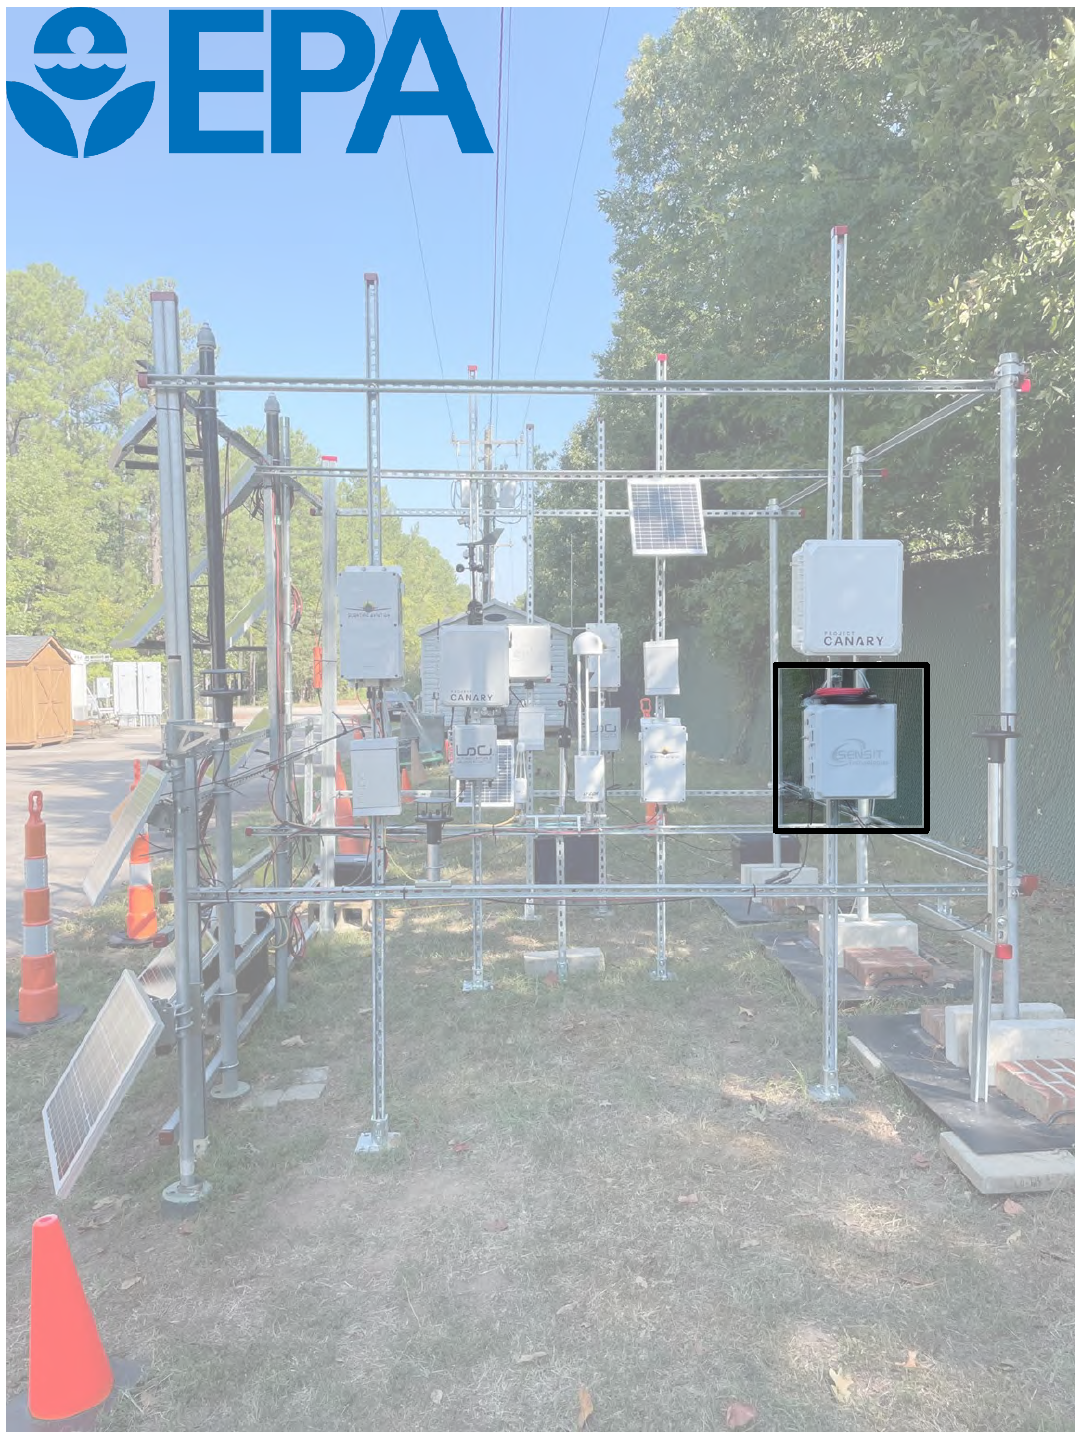
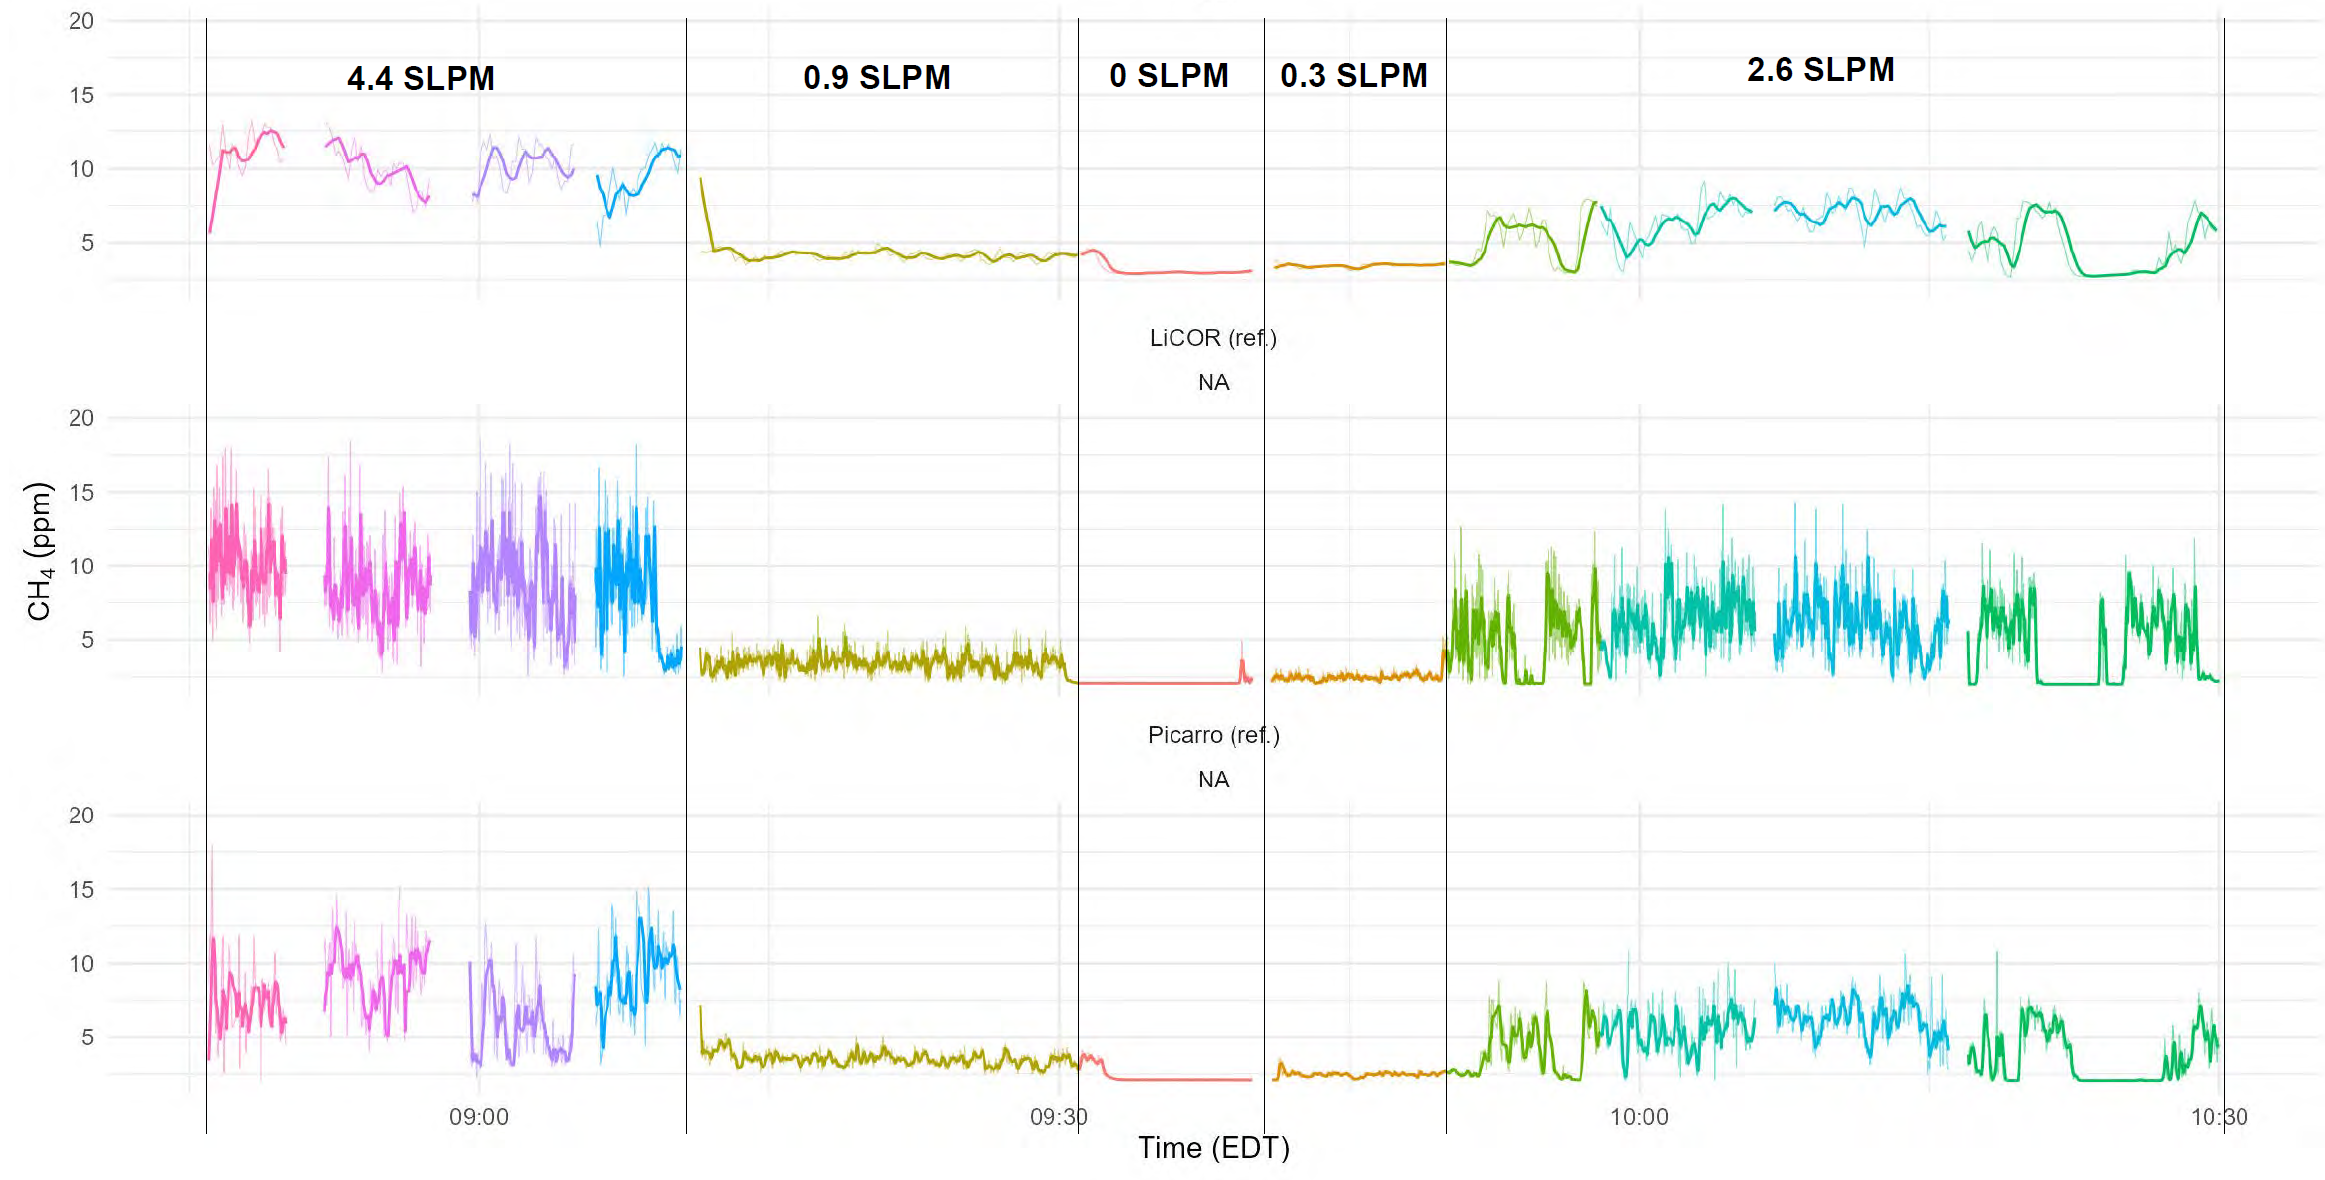
- SENSIT FMD TDLAS system co-located with other methane detectors and reference instruments
Minimum Detection Limit (MDL = 3X 𝝈 (St.Dev.)
Co-located with reference instruments
Calculations are 0.1 Hz Noise Based MDL (Excluding Drift Term). No baseline corrections applied
Preliminary data - MDL measurements and calculations are ongoing and contain the noise term only.
10-s FMD Pre-Test [PPM]
| Day | x̅ | 𝝈 | MDL |
| 1 | 2.96 | 0.021 | 0.063 |
| 2 | 3.02 | 0.030 | 0.089 |
| 3 | 3.43 | 0.014 | 0.044 |
| 4 | 3.14 | 0.028 | 0.833 |
| Avg. | 3.14 | 0.234 | 0.070 |
10-s Reference Grade [PPM]
| Inst. | x̅ | 𝝈 | MDL |
| Ref 1 | 2.20 | 0.003 | 0.010 |
| Ref 2 | 2.17 | 0.010 | 0.030 |
10-s FMD Between Tests
| Day | x̅ | 𝝈 | MDL |
| 1 | 2.49 | 0.041 | 0.122 |
| 2 | 2.97 | 0.029 | 0.086 |
| 3 | 3.25 | 0.081 | 0.243 |
| 4 | - | - | - |
| Avg. | 2.90 | 0.050 | 0.150 |
Deployed FMD
Measuring wind speed, wind direction, CH4 concentrationCSU METEC DEPLOYMENT
| Deployment | Start | 2/8/2023 | End | 4/28/2024 |
| TEMPERATURE | Minimum | -25.5°C | Maximum | 29°C |
| Events | Experiments | 279 | Releases | 565 |
| Avg. Release Size | 1566 g/hr | Avg. Duration | 3.11 hr |
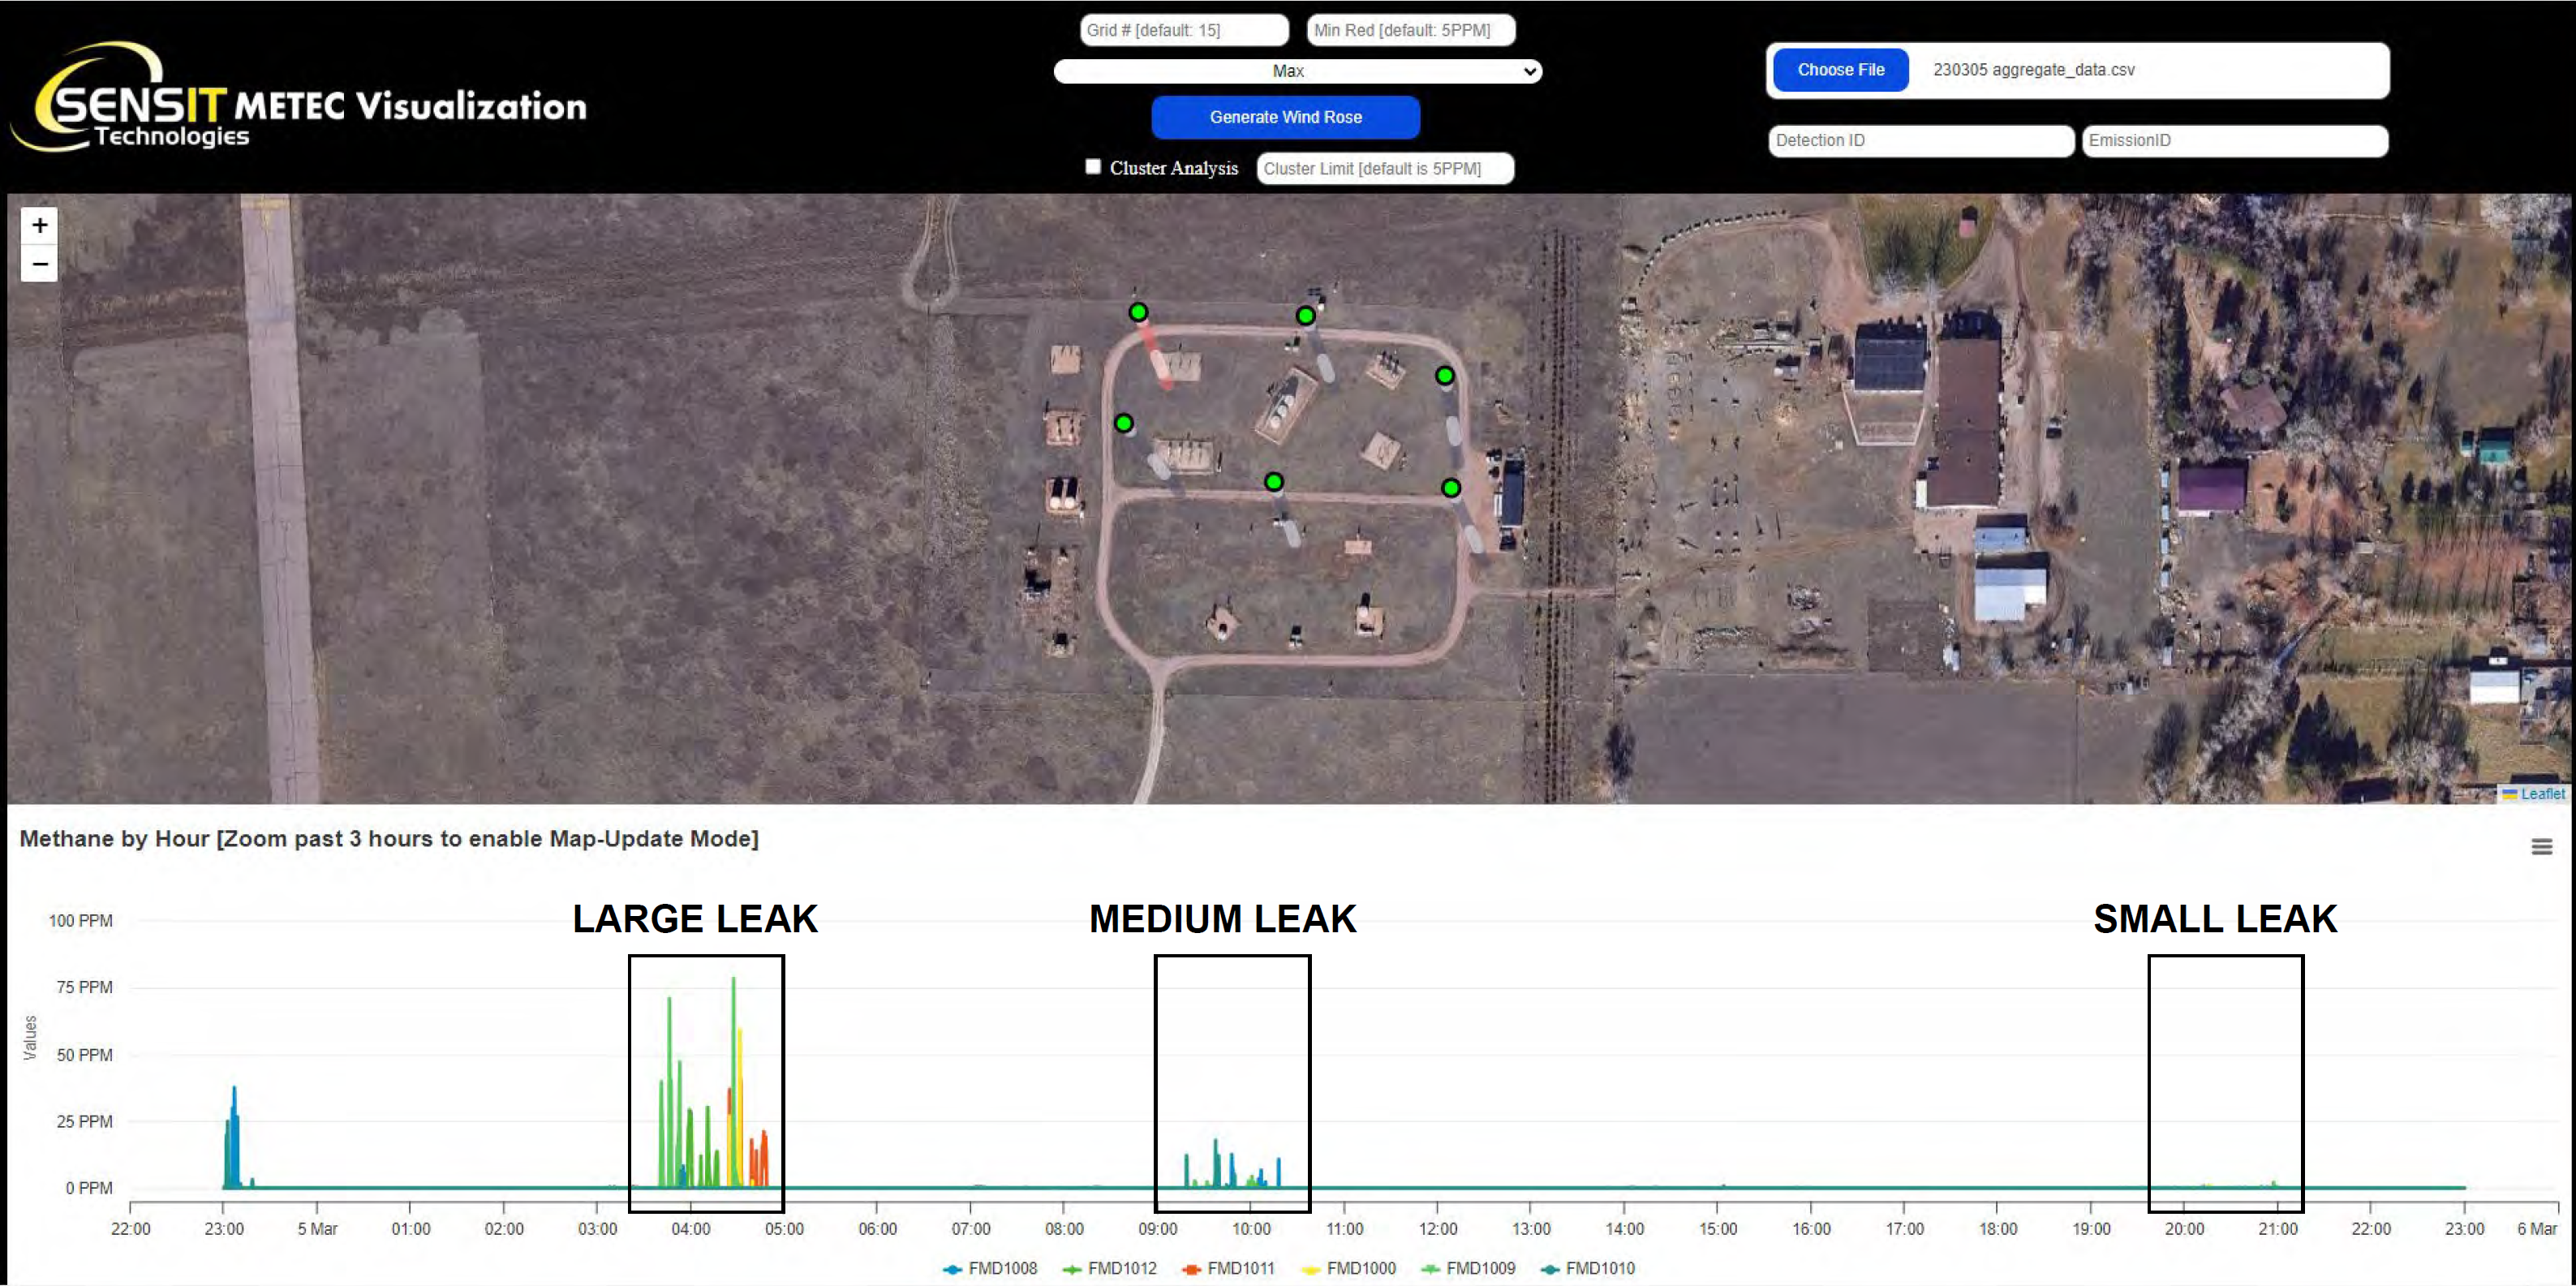
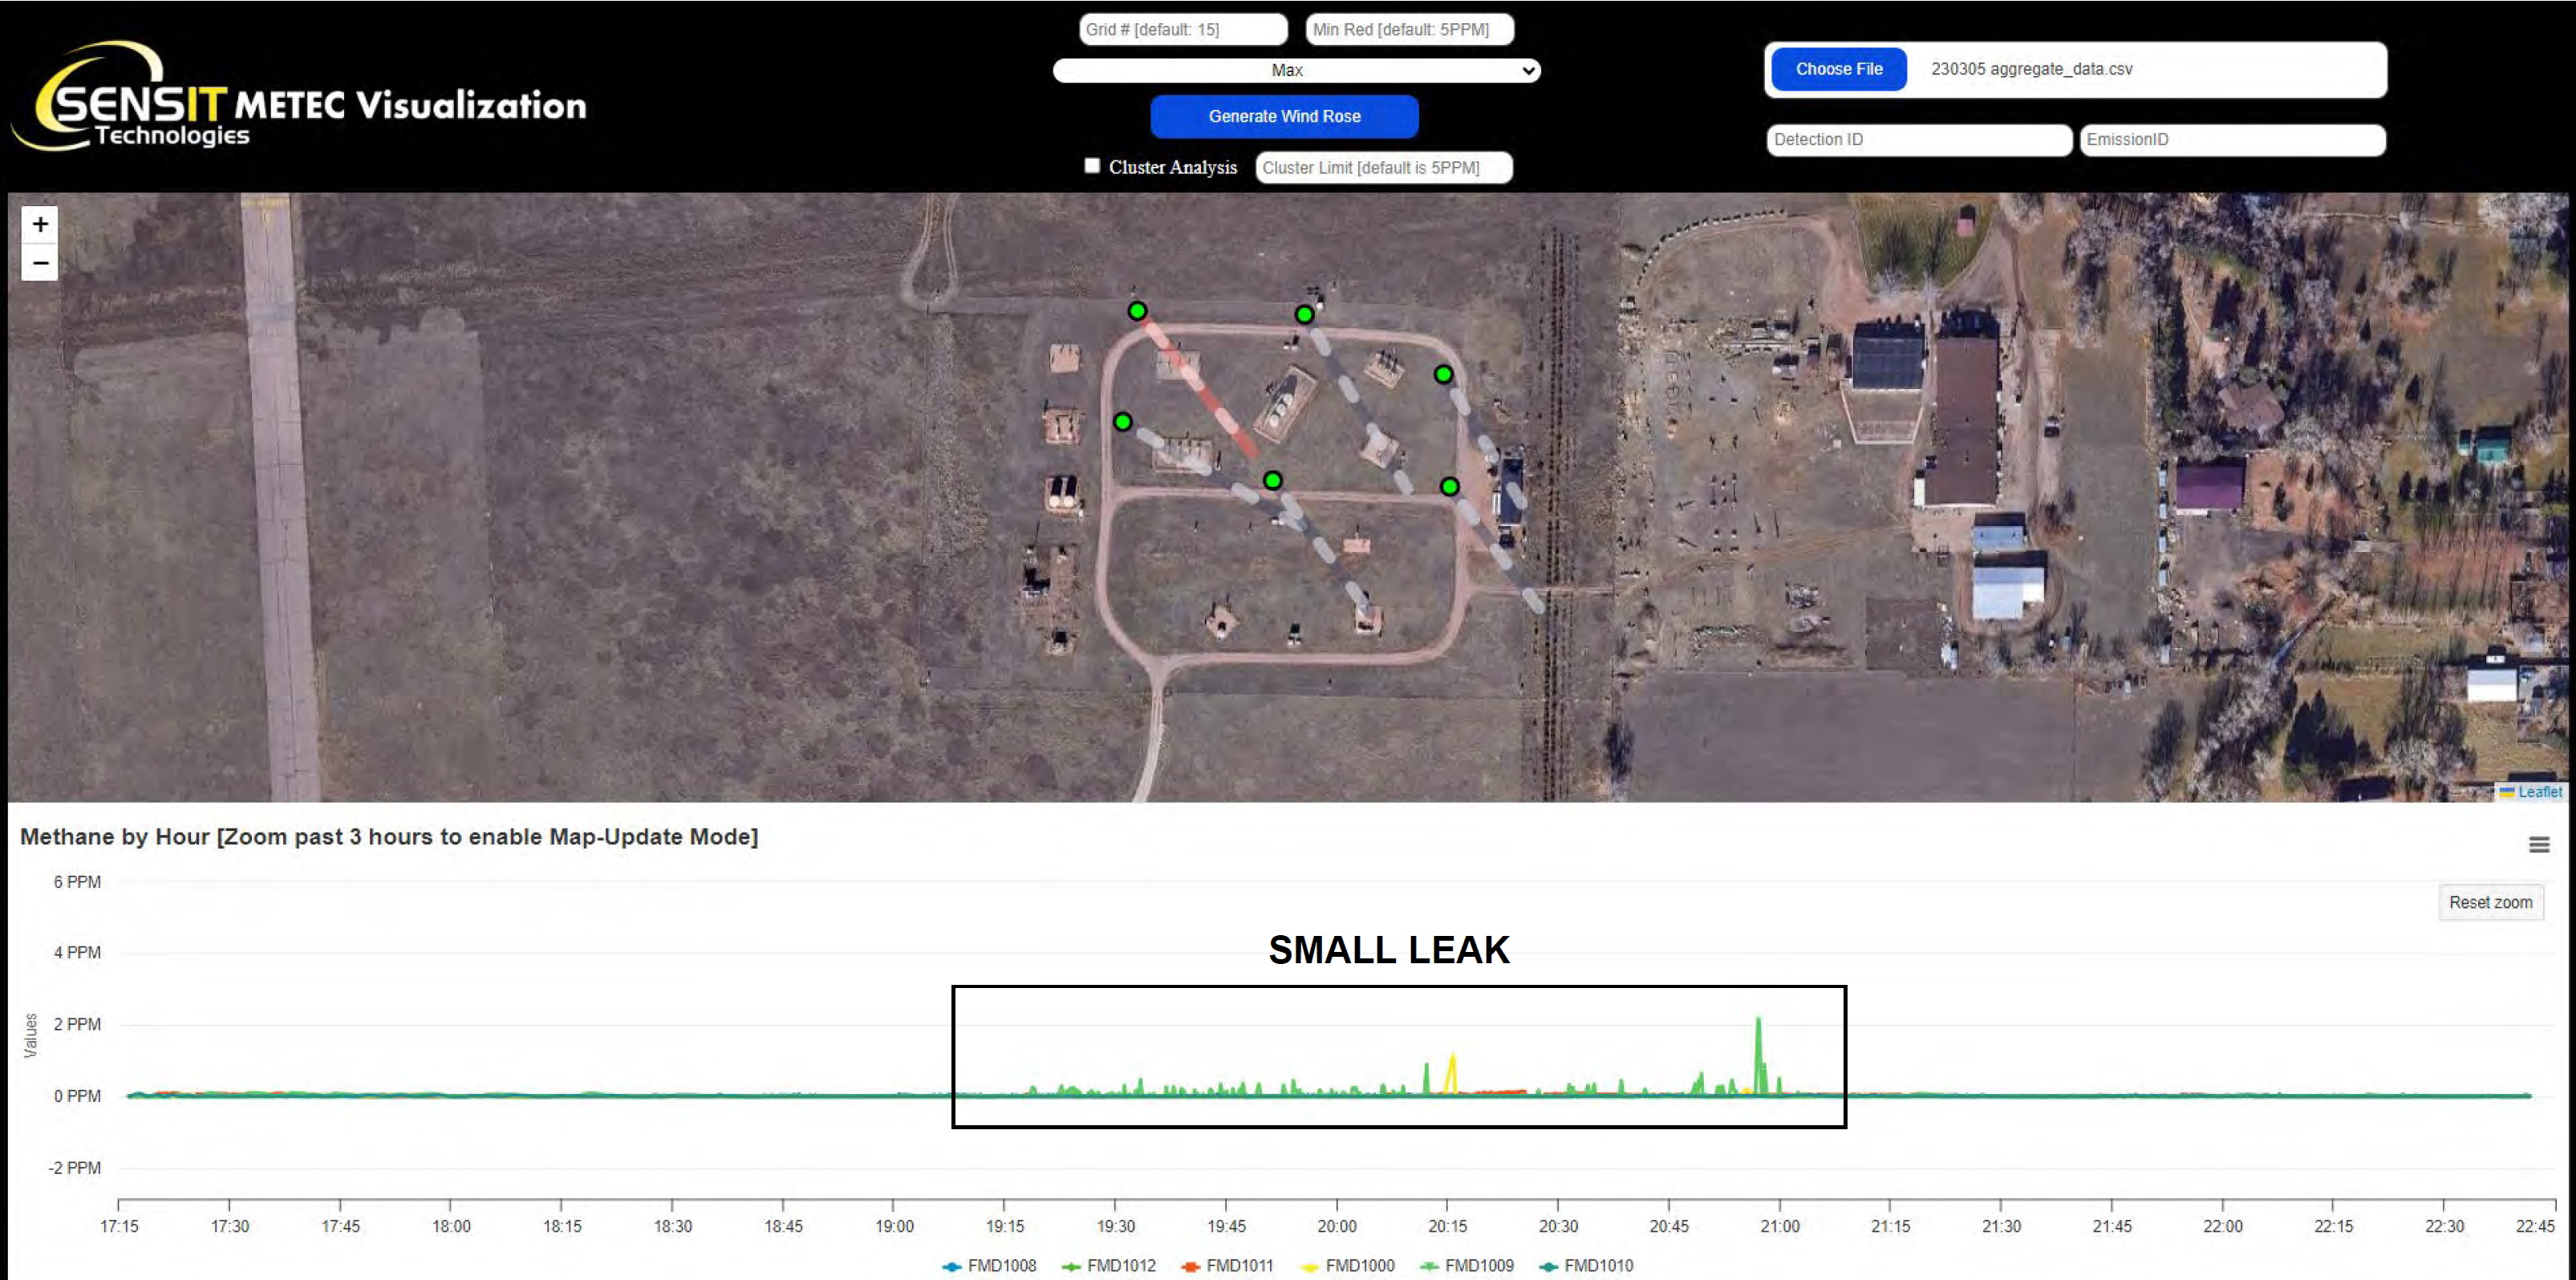
METEC RESULTS – Provider P
- Accomplished via manual visual inspection of the data*
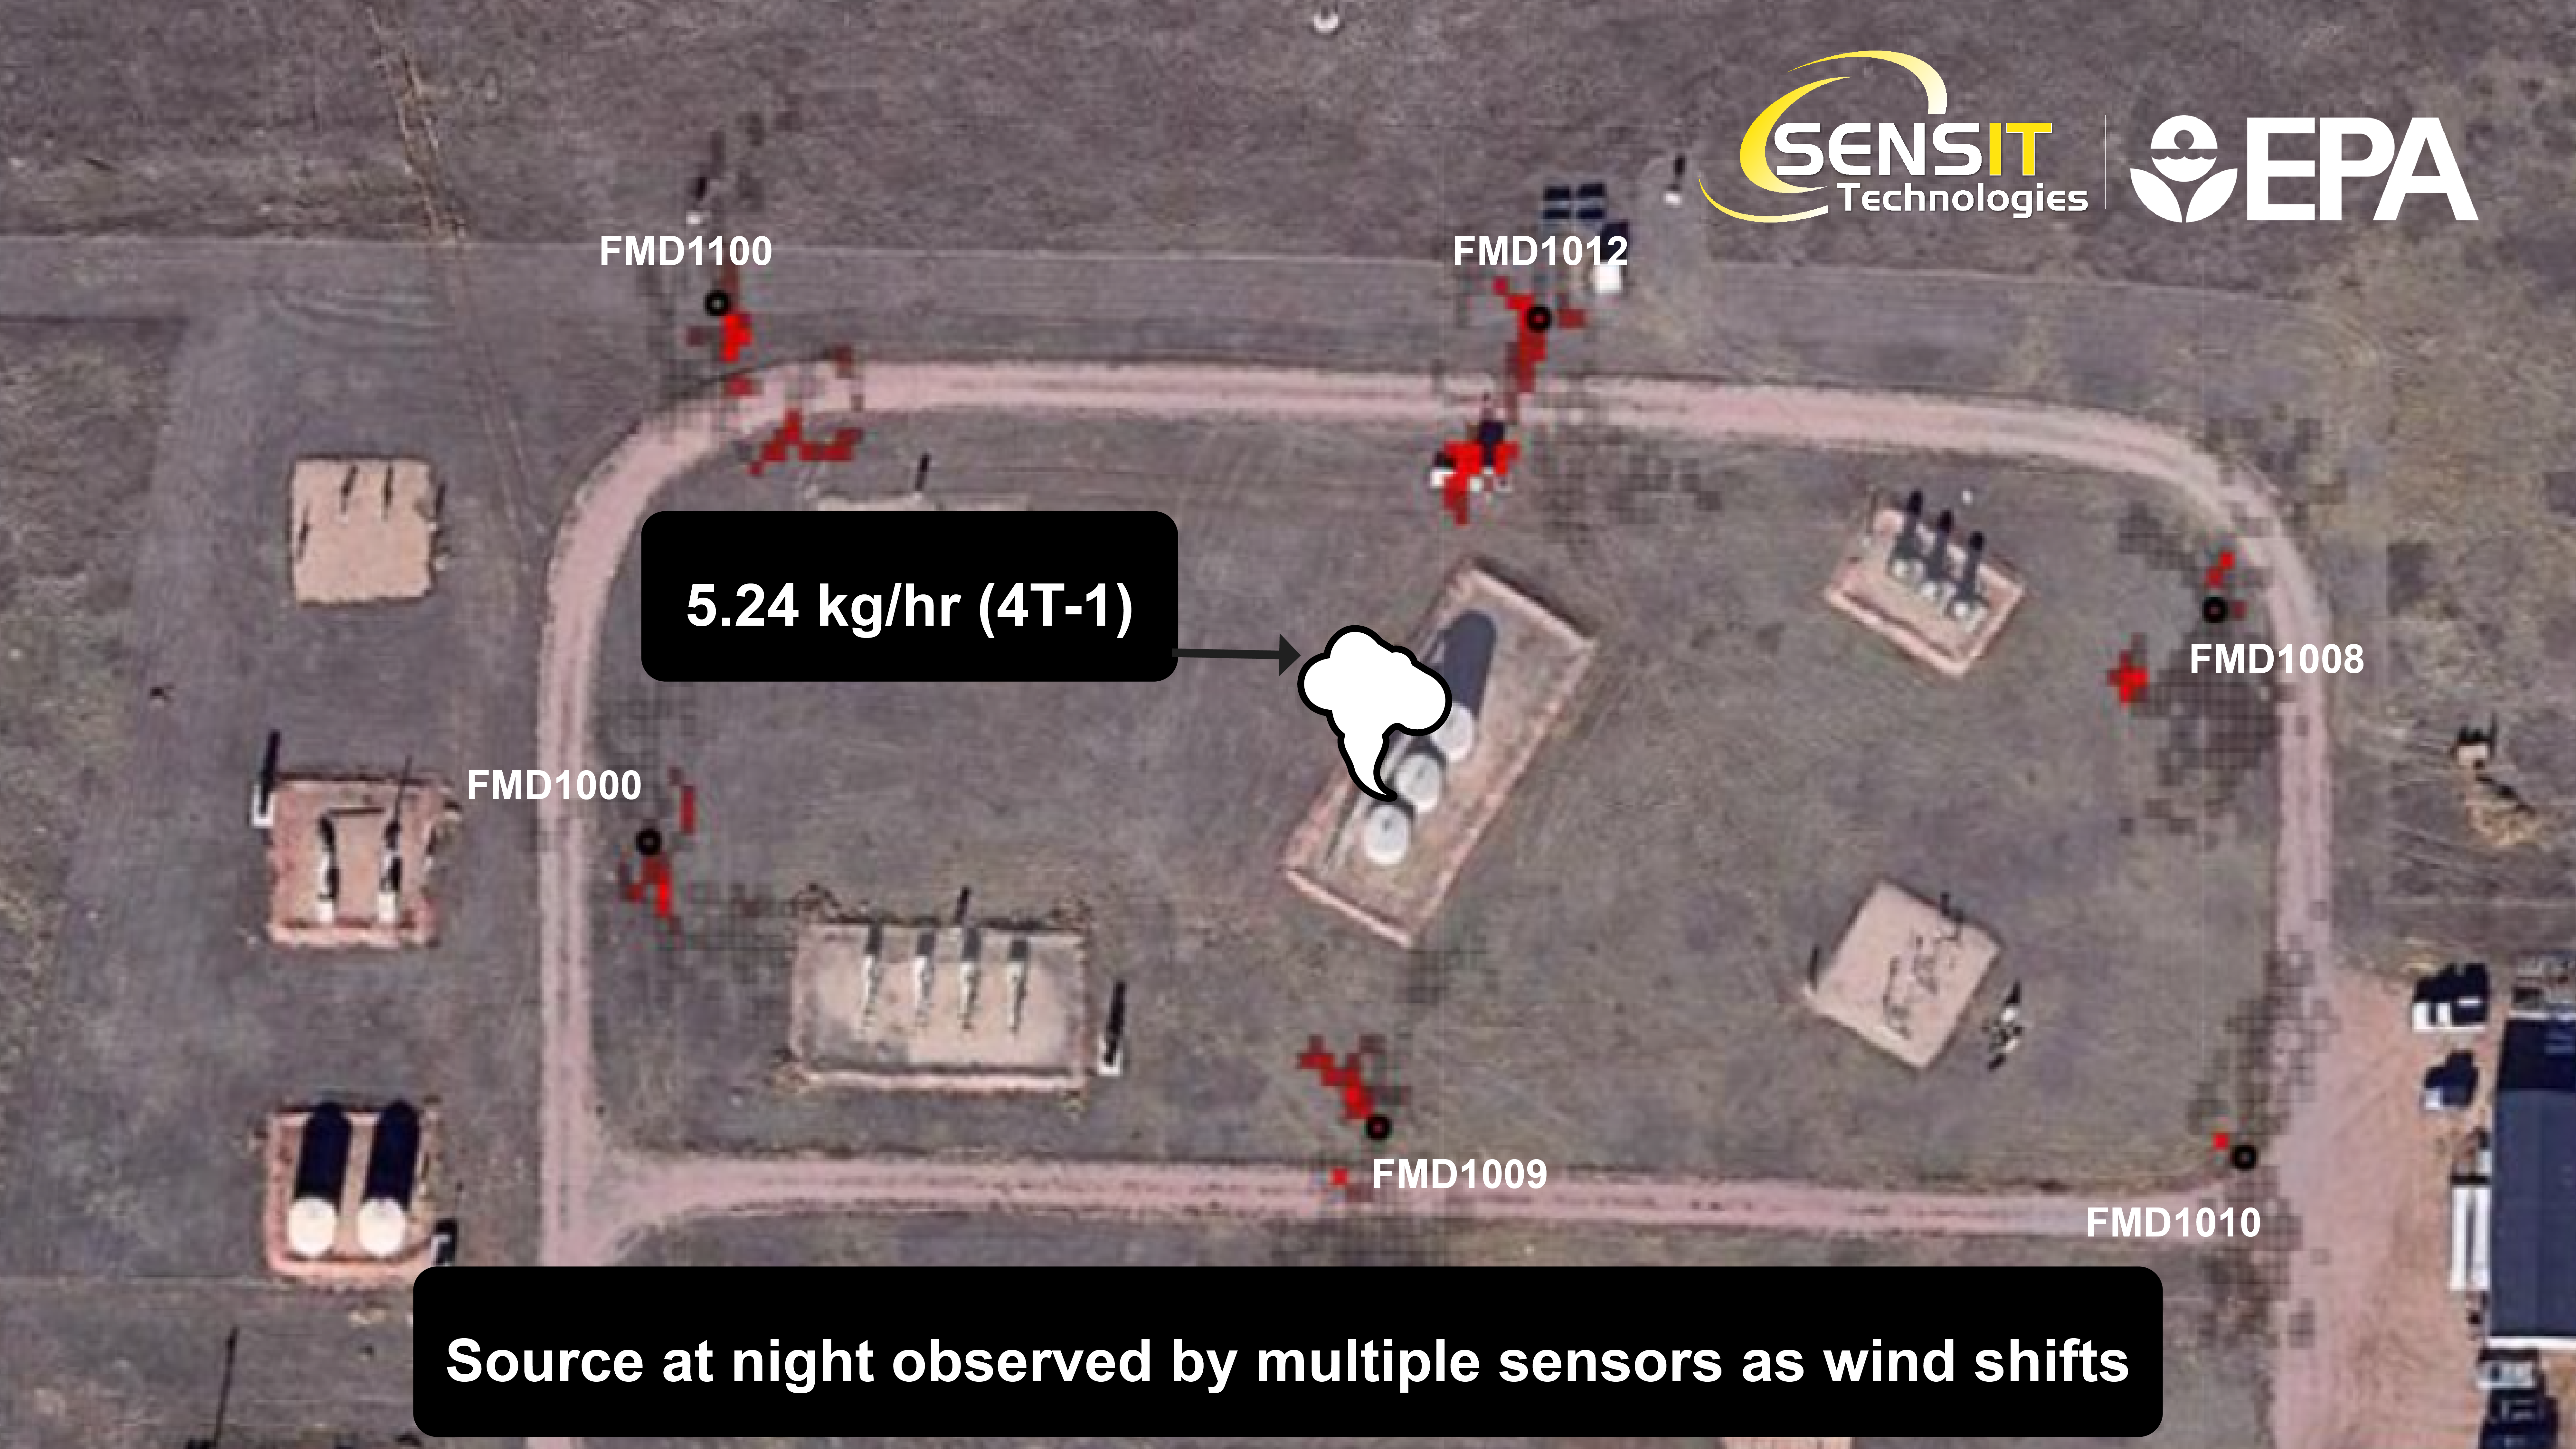
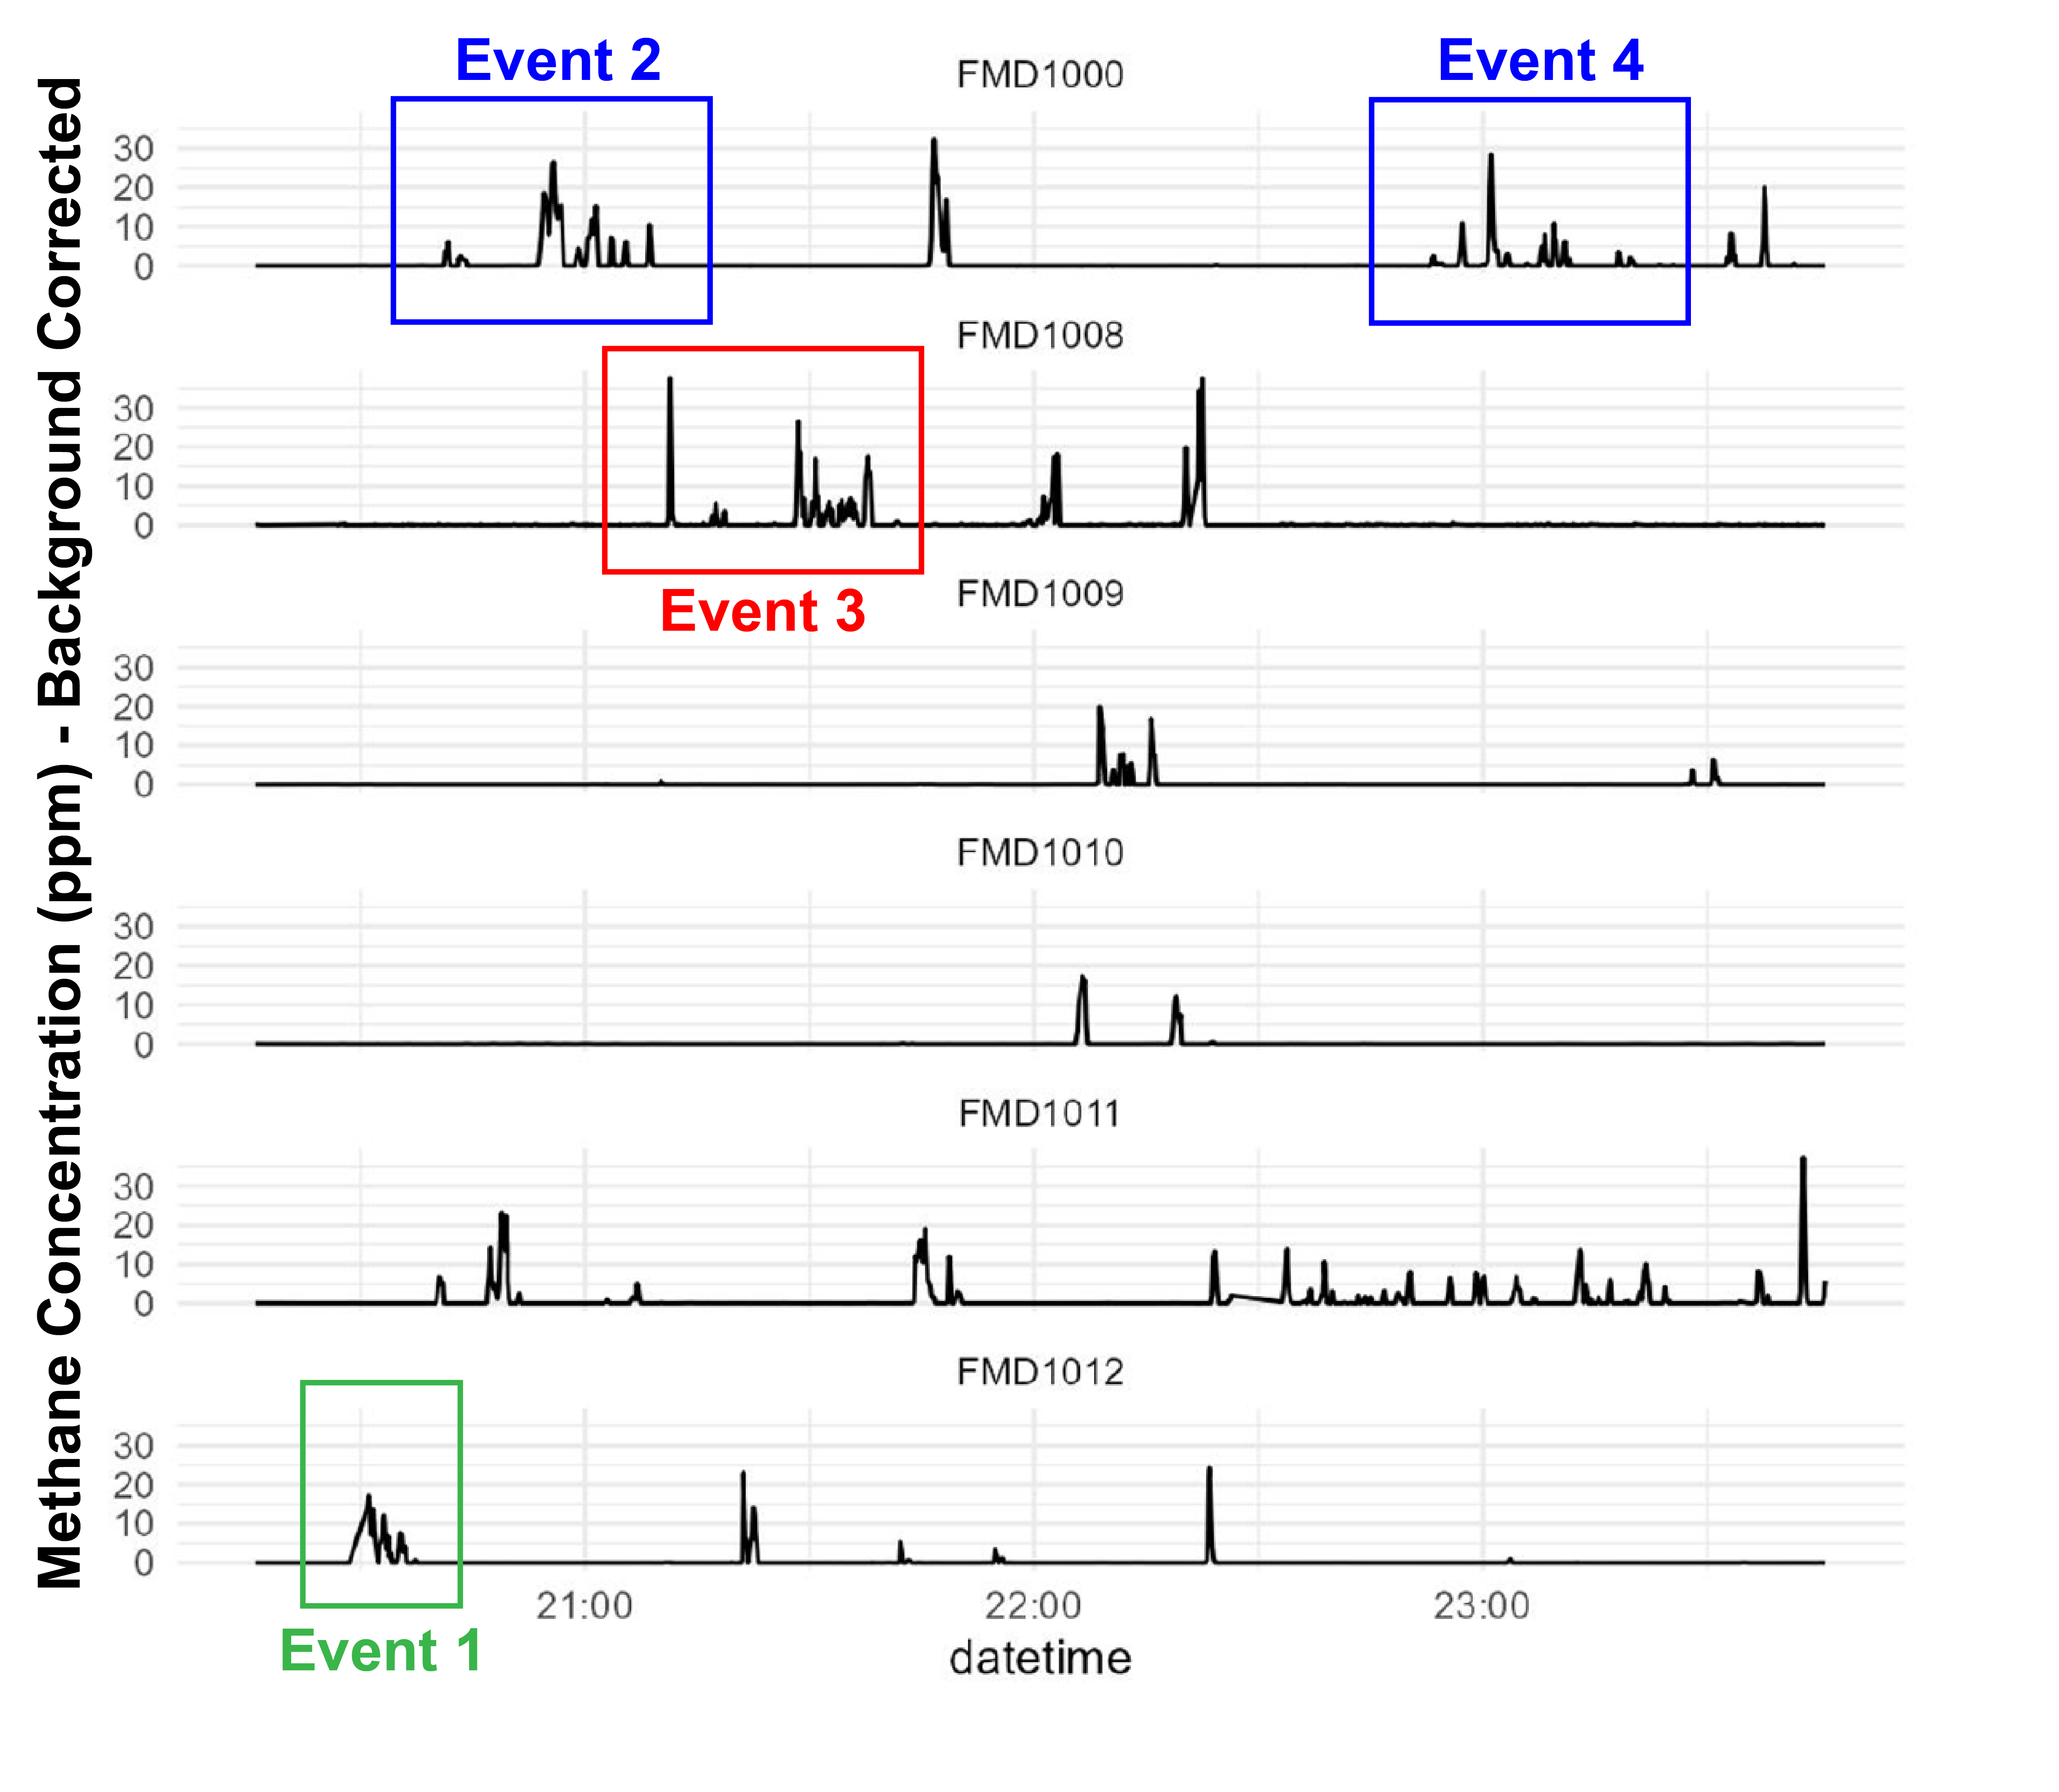
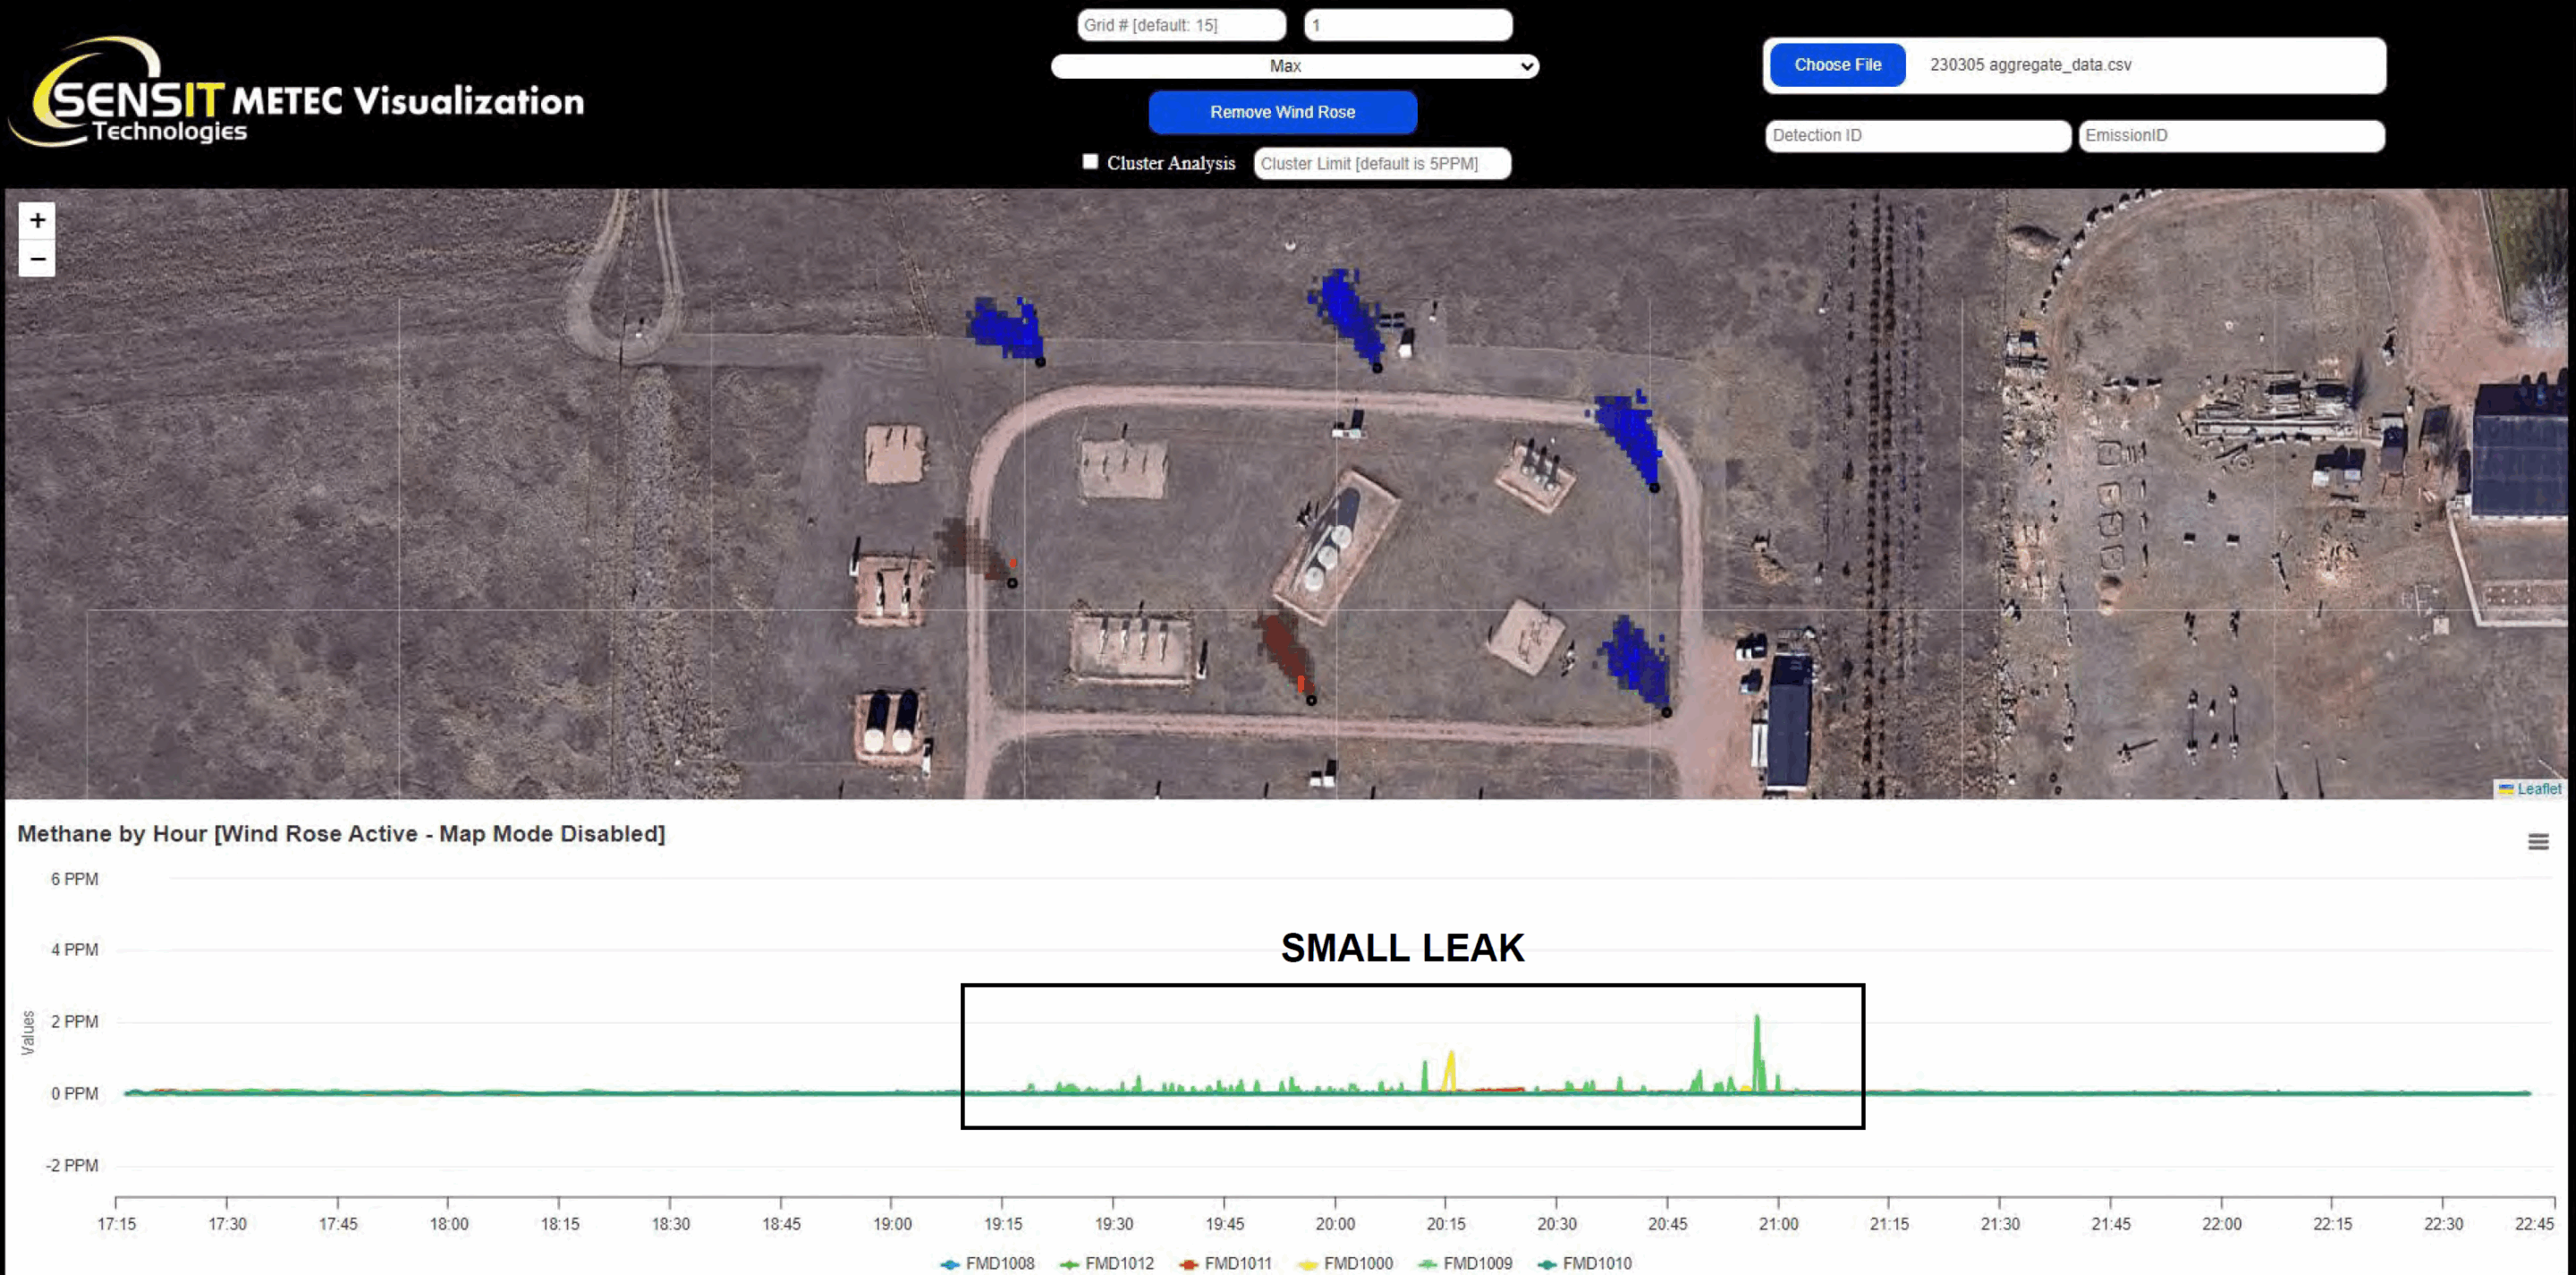
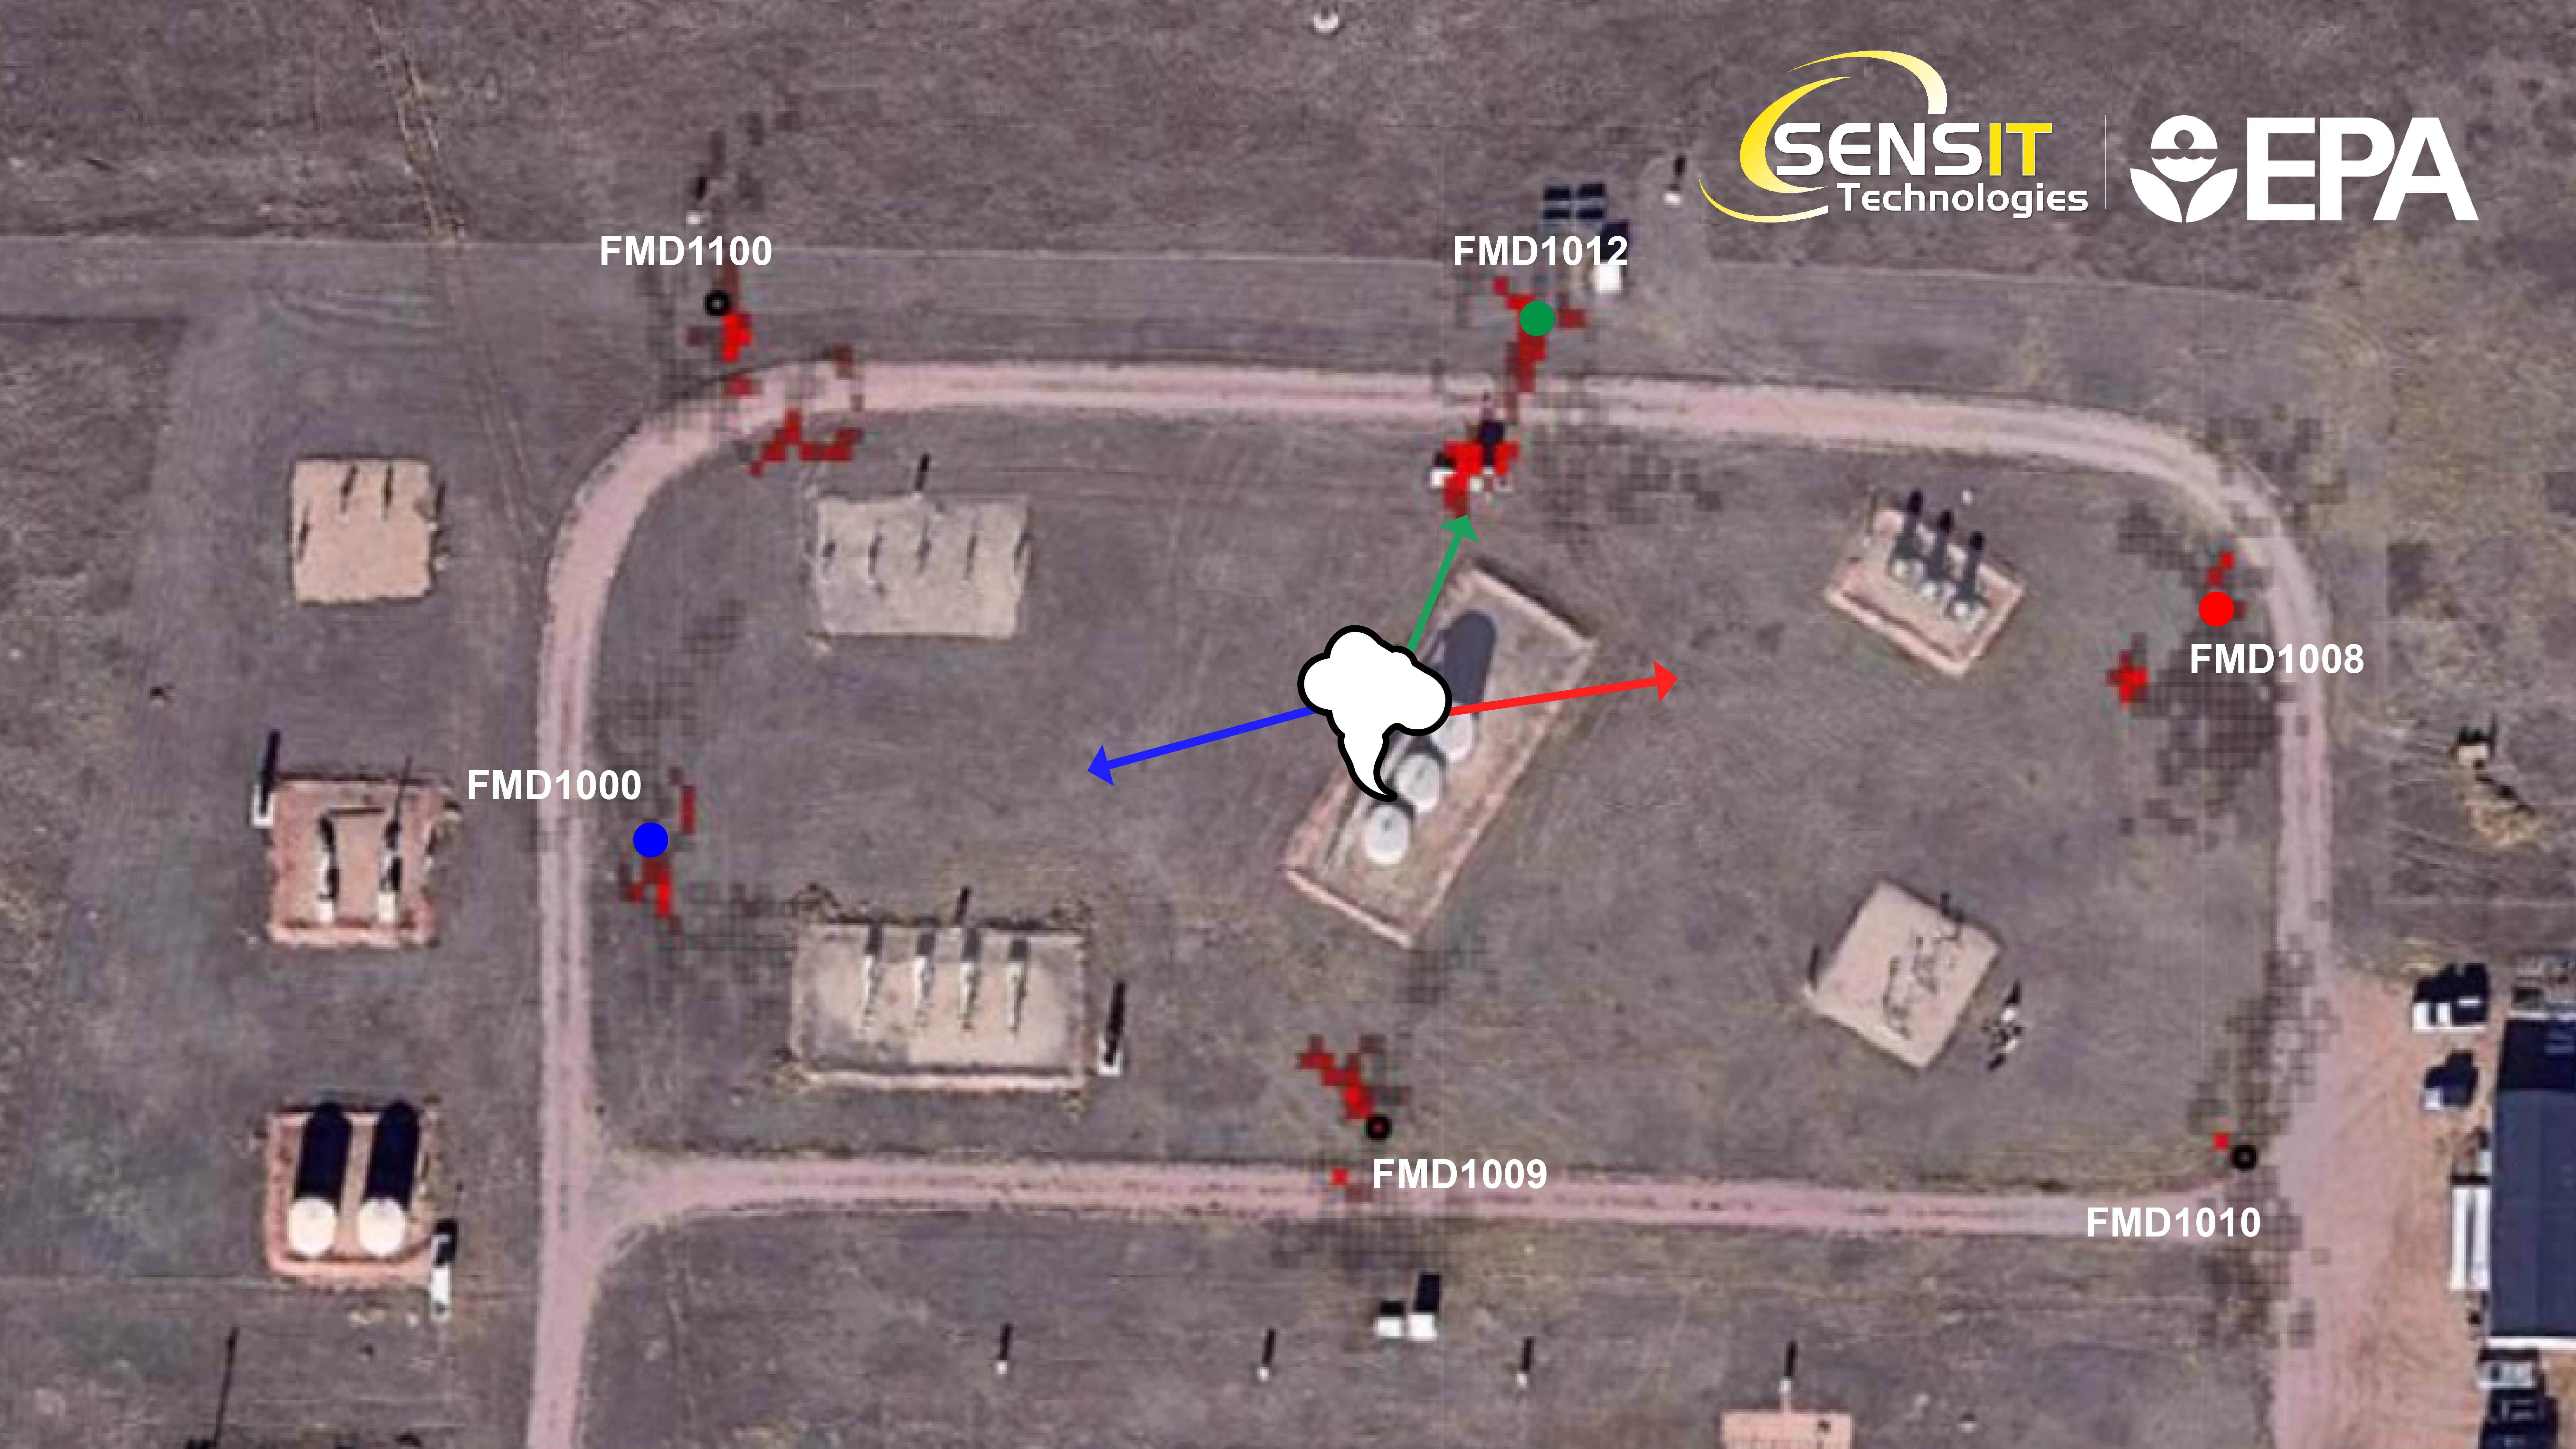
- As wind direction changes, the source is observed by different sensor nodes
- Some detections at very low wind speeds are off-axis and are not good for quantification
- Let's look at four sub-events
(marked by colored squares)- FMD1012 (North) - Event 1
- FMD1000 (West) - Events 2 and 4
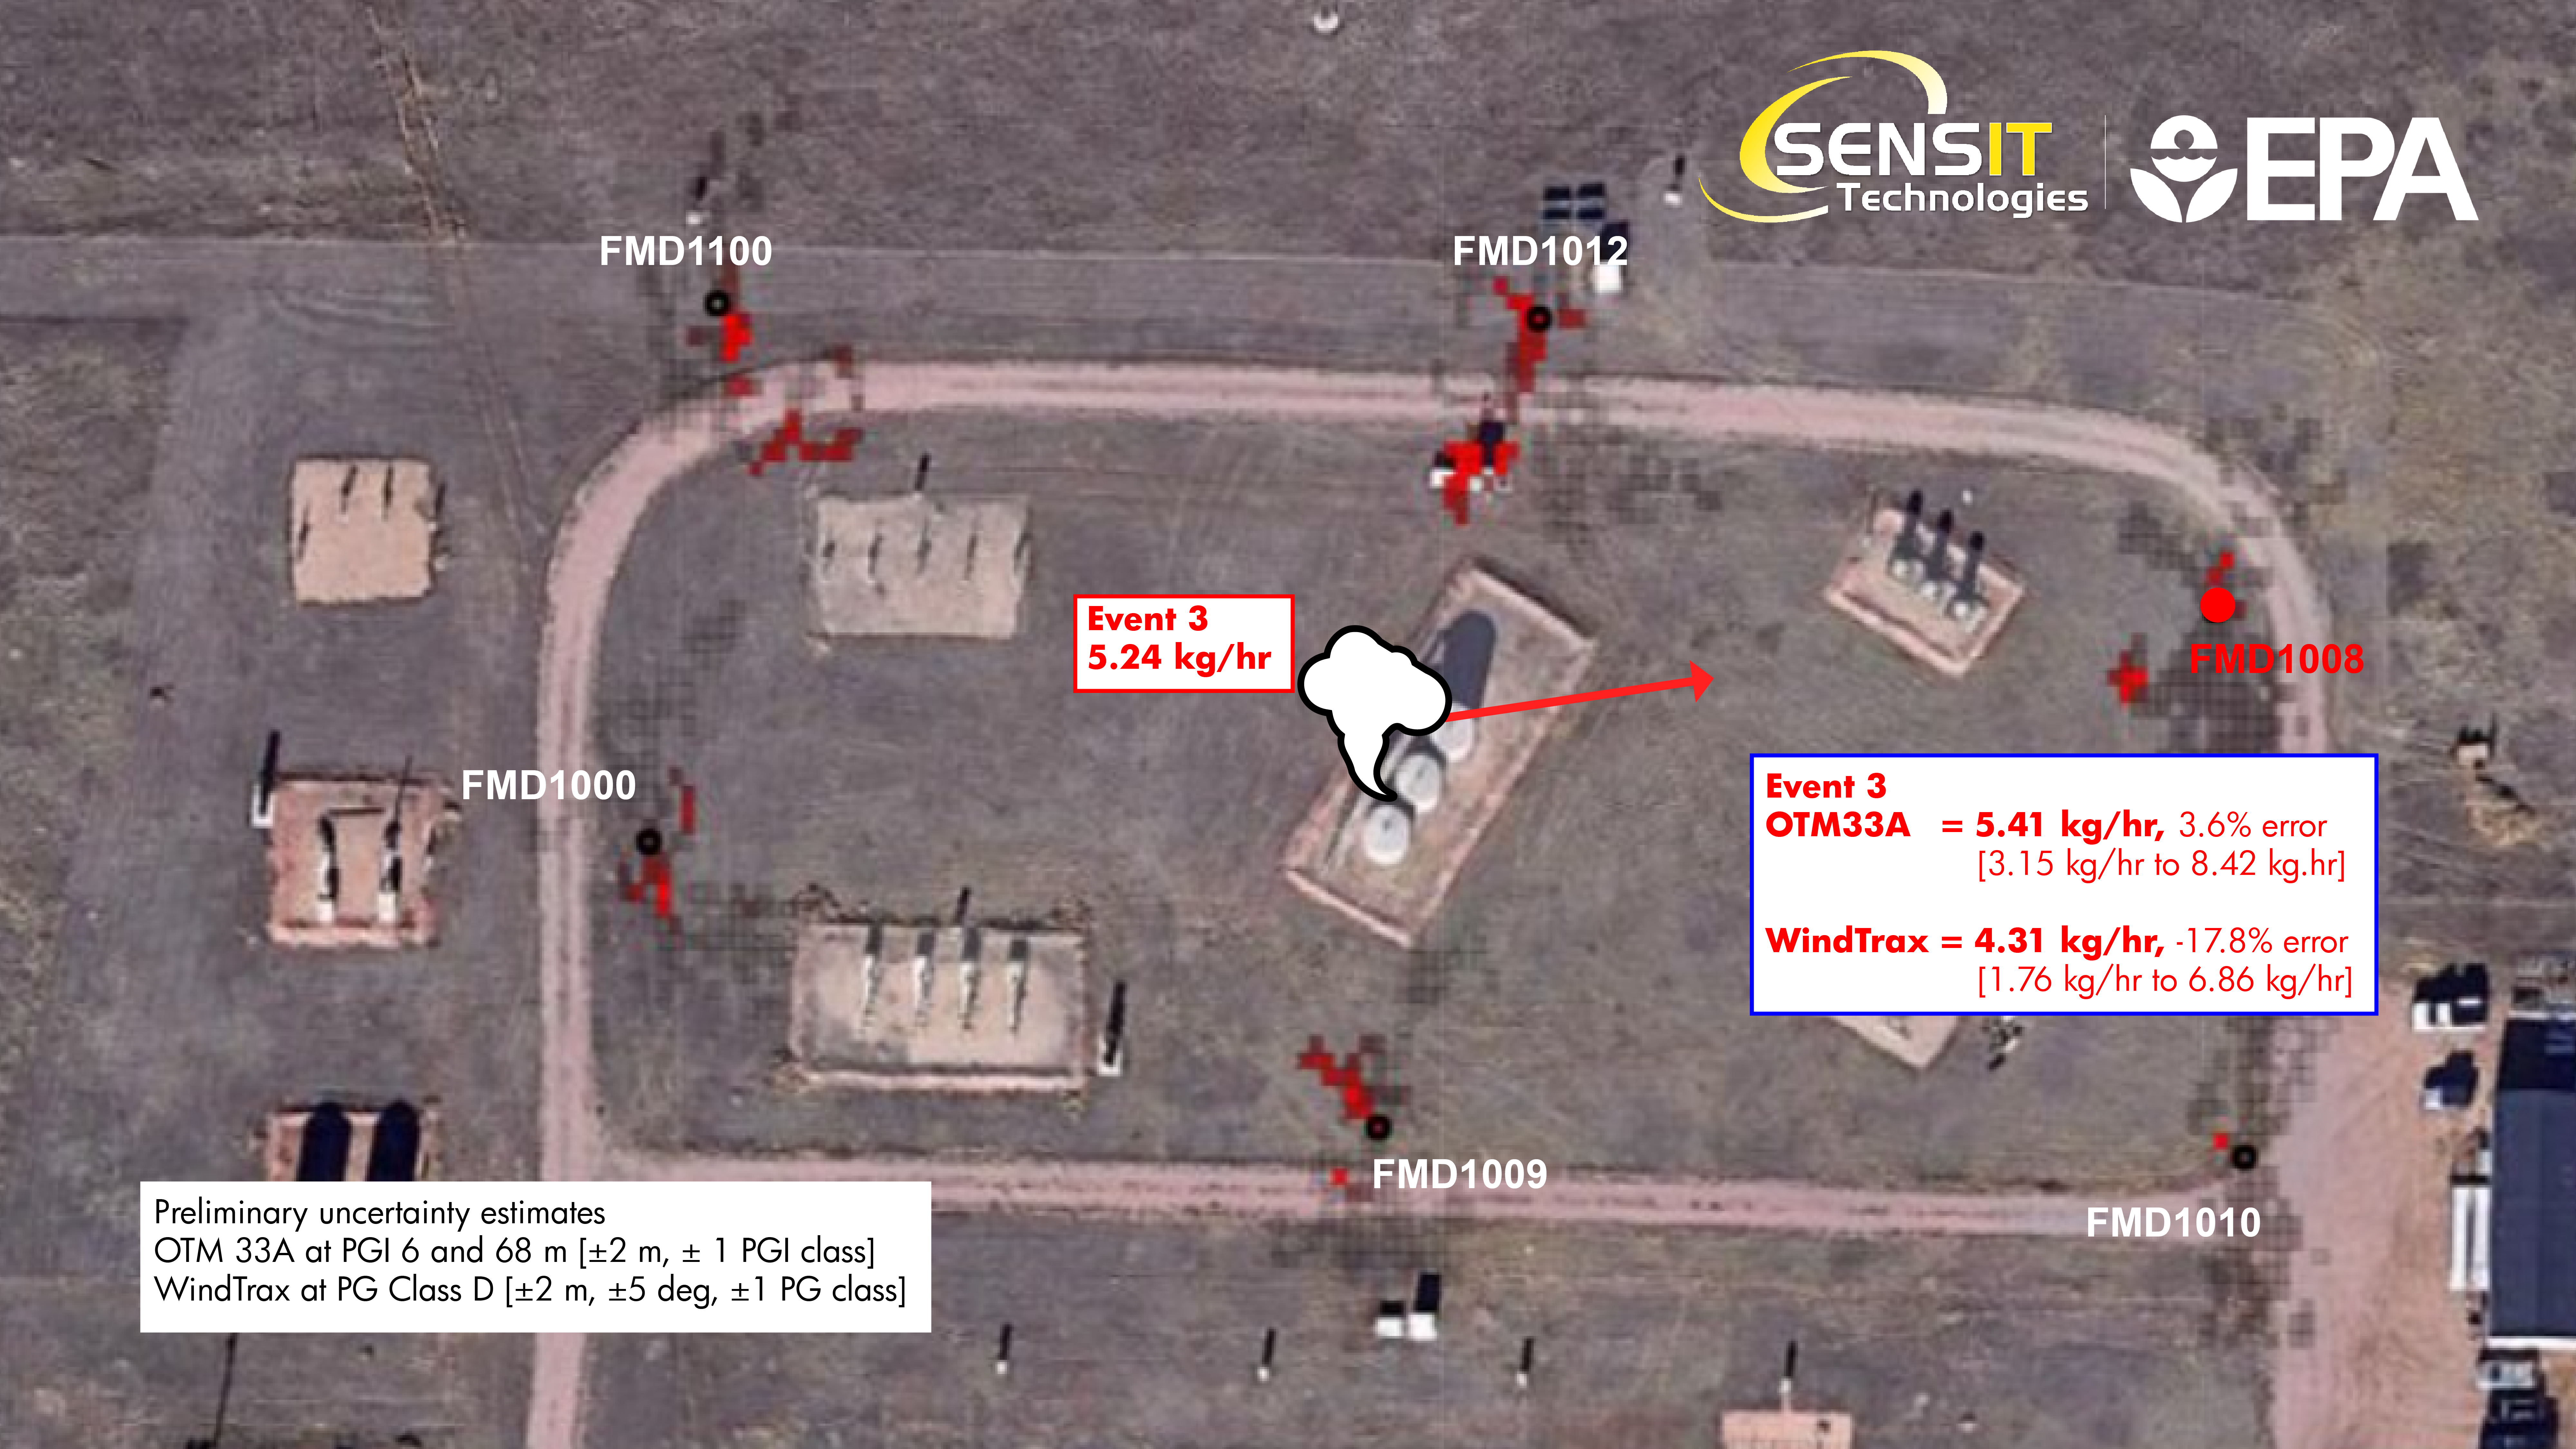
- FMD 1008 (East) - Event 3
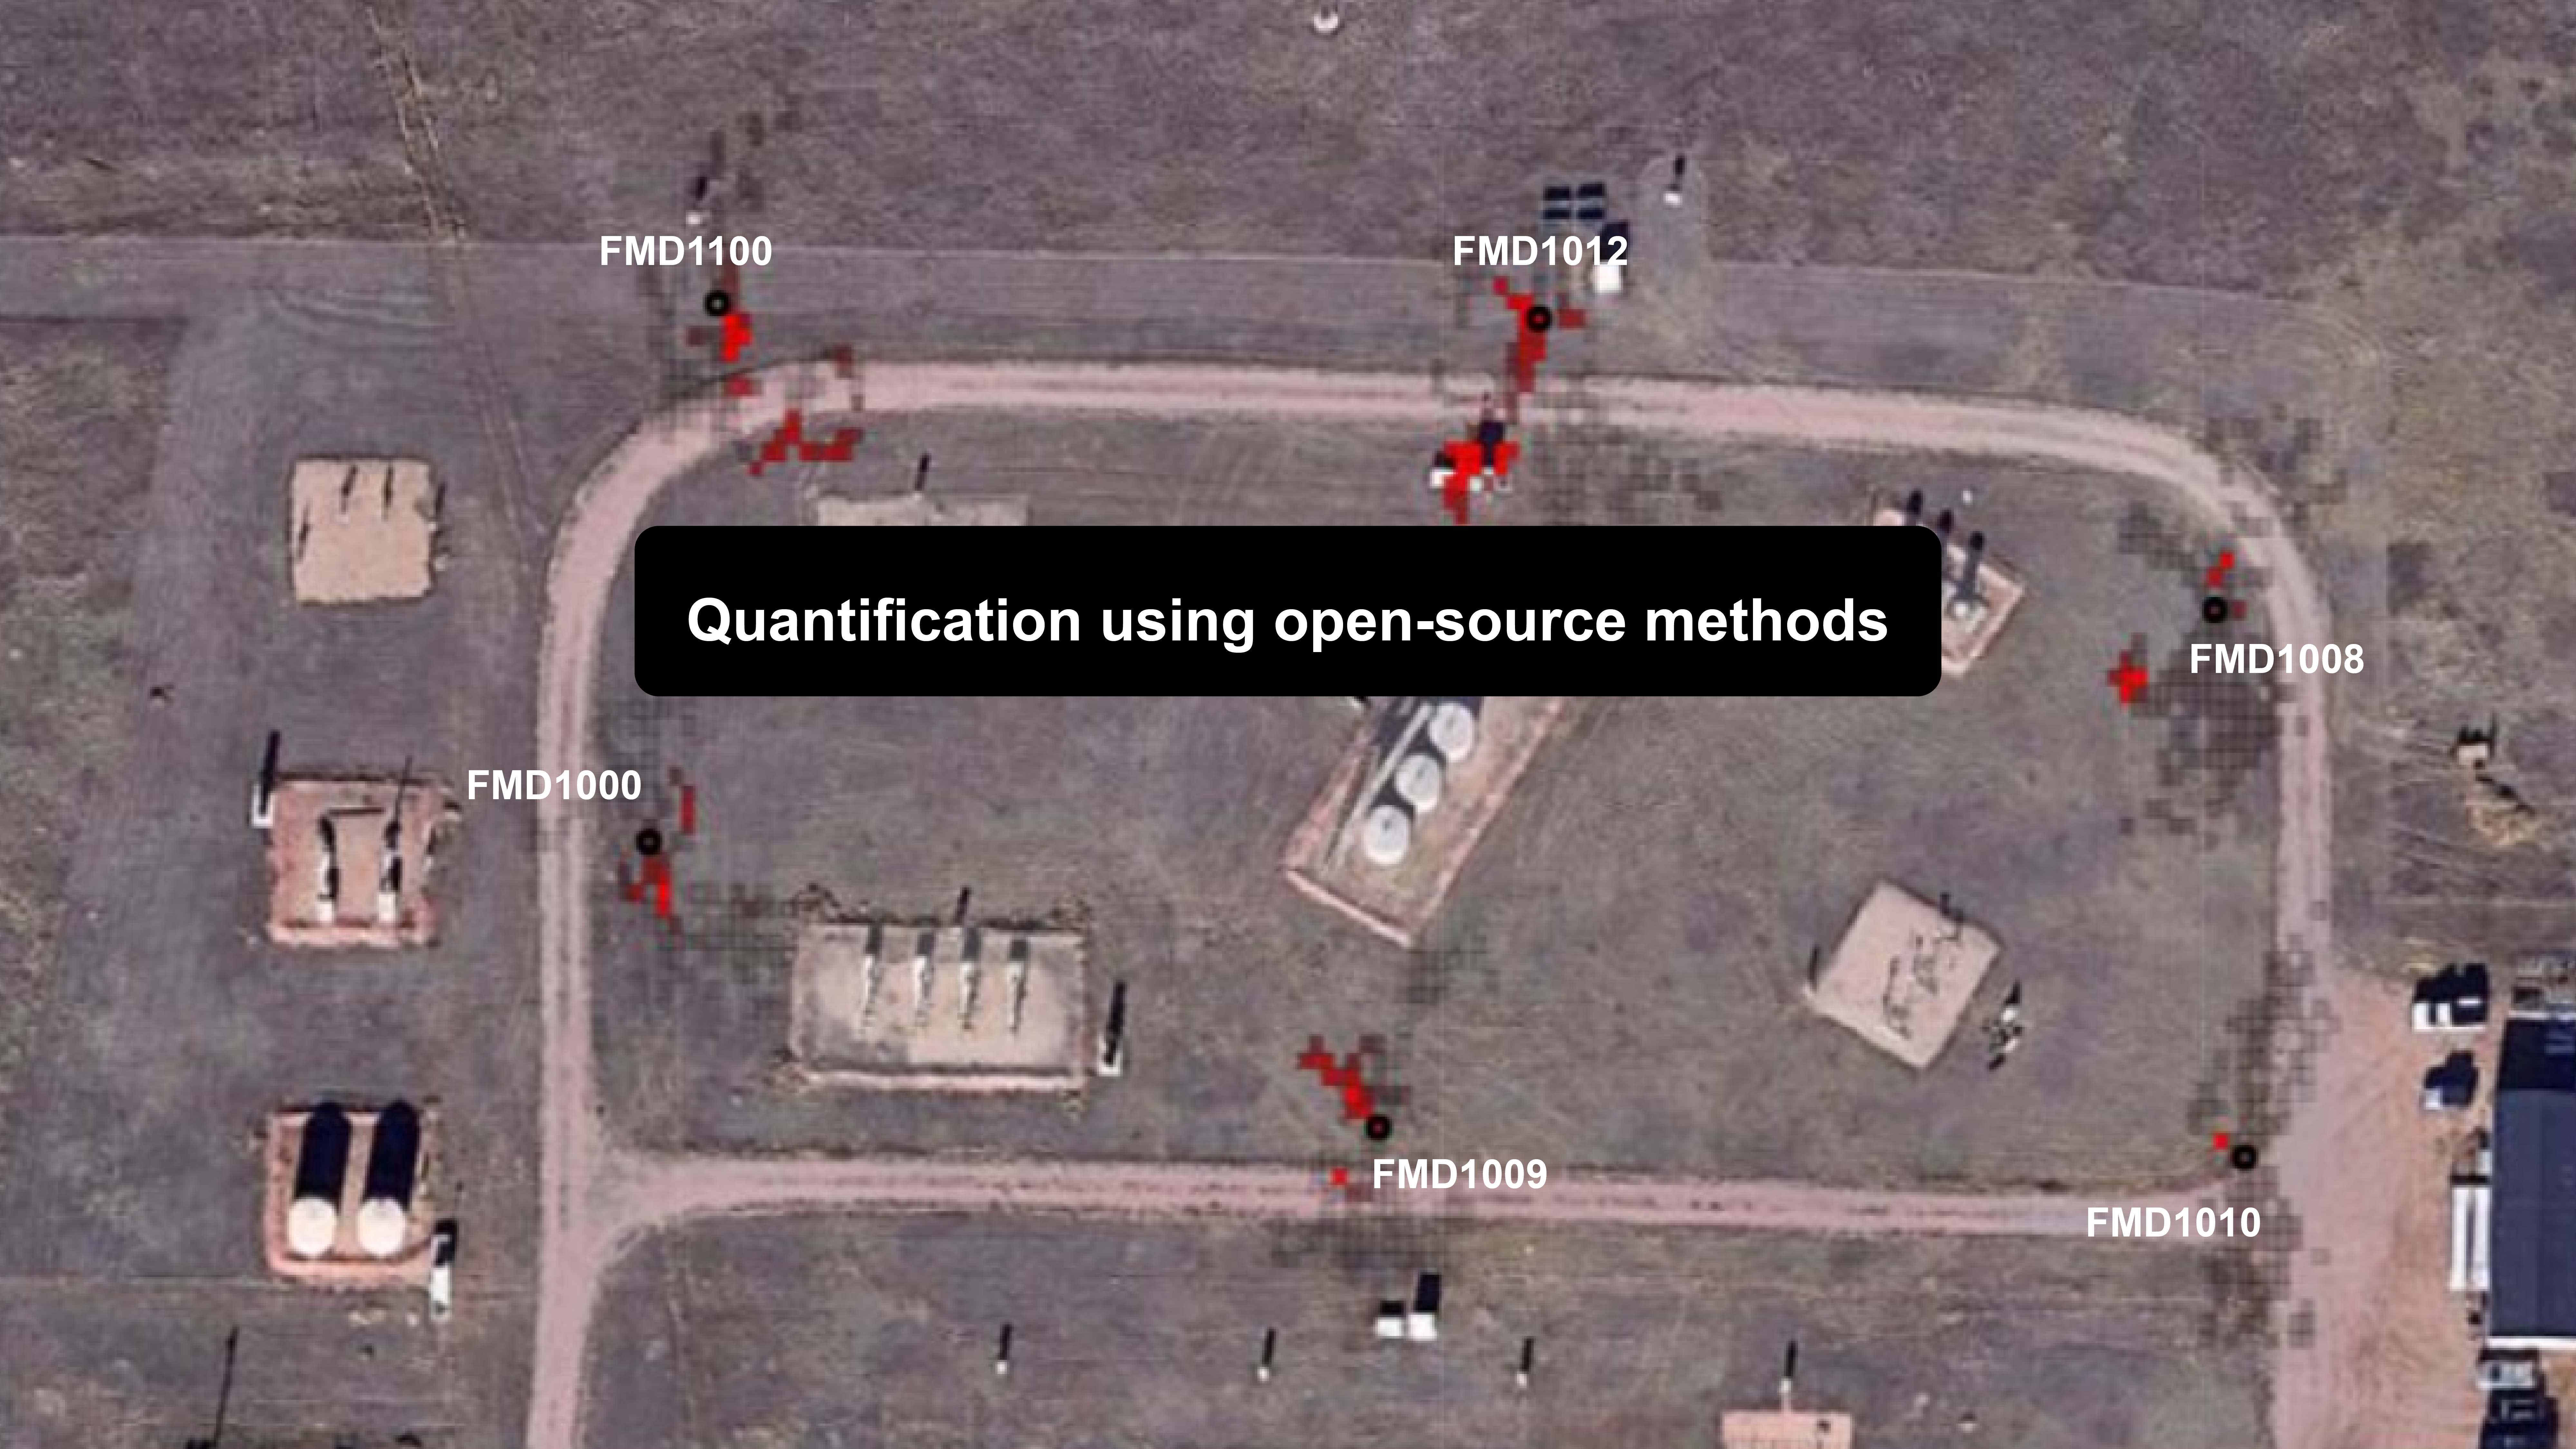
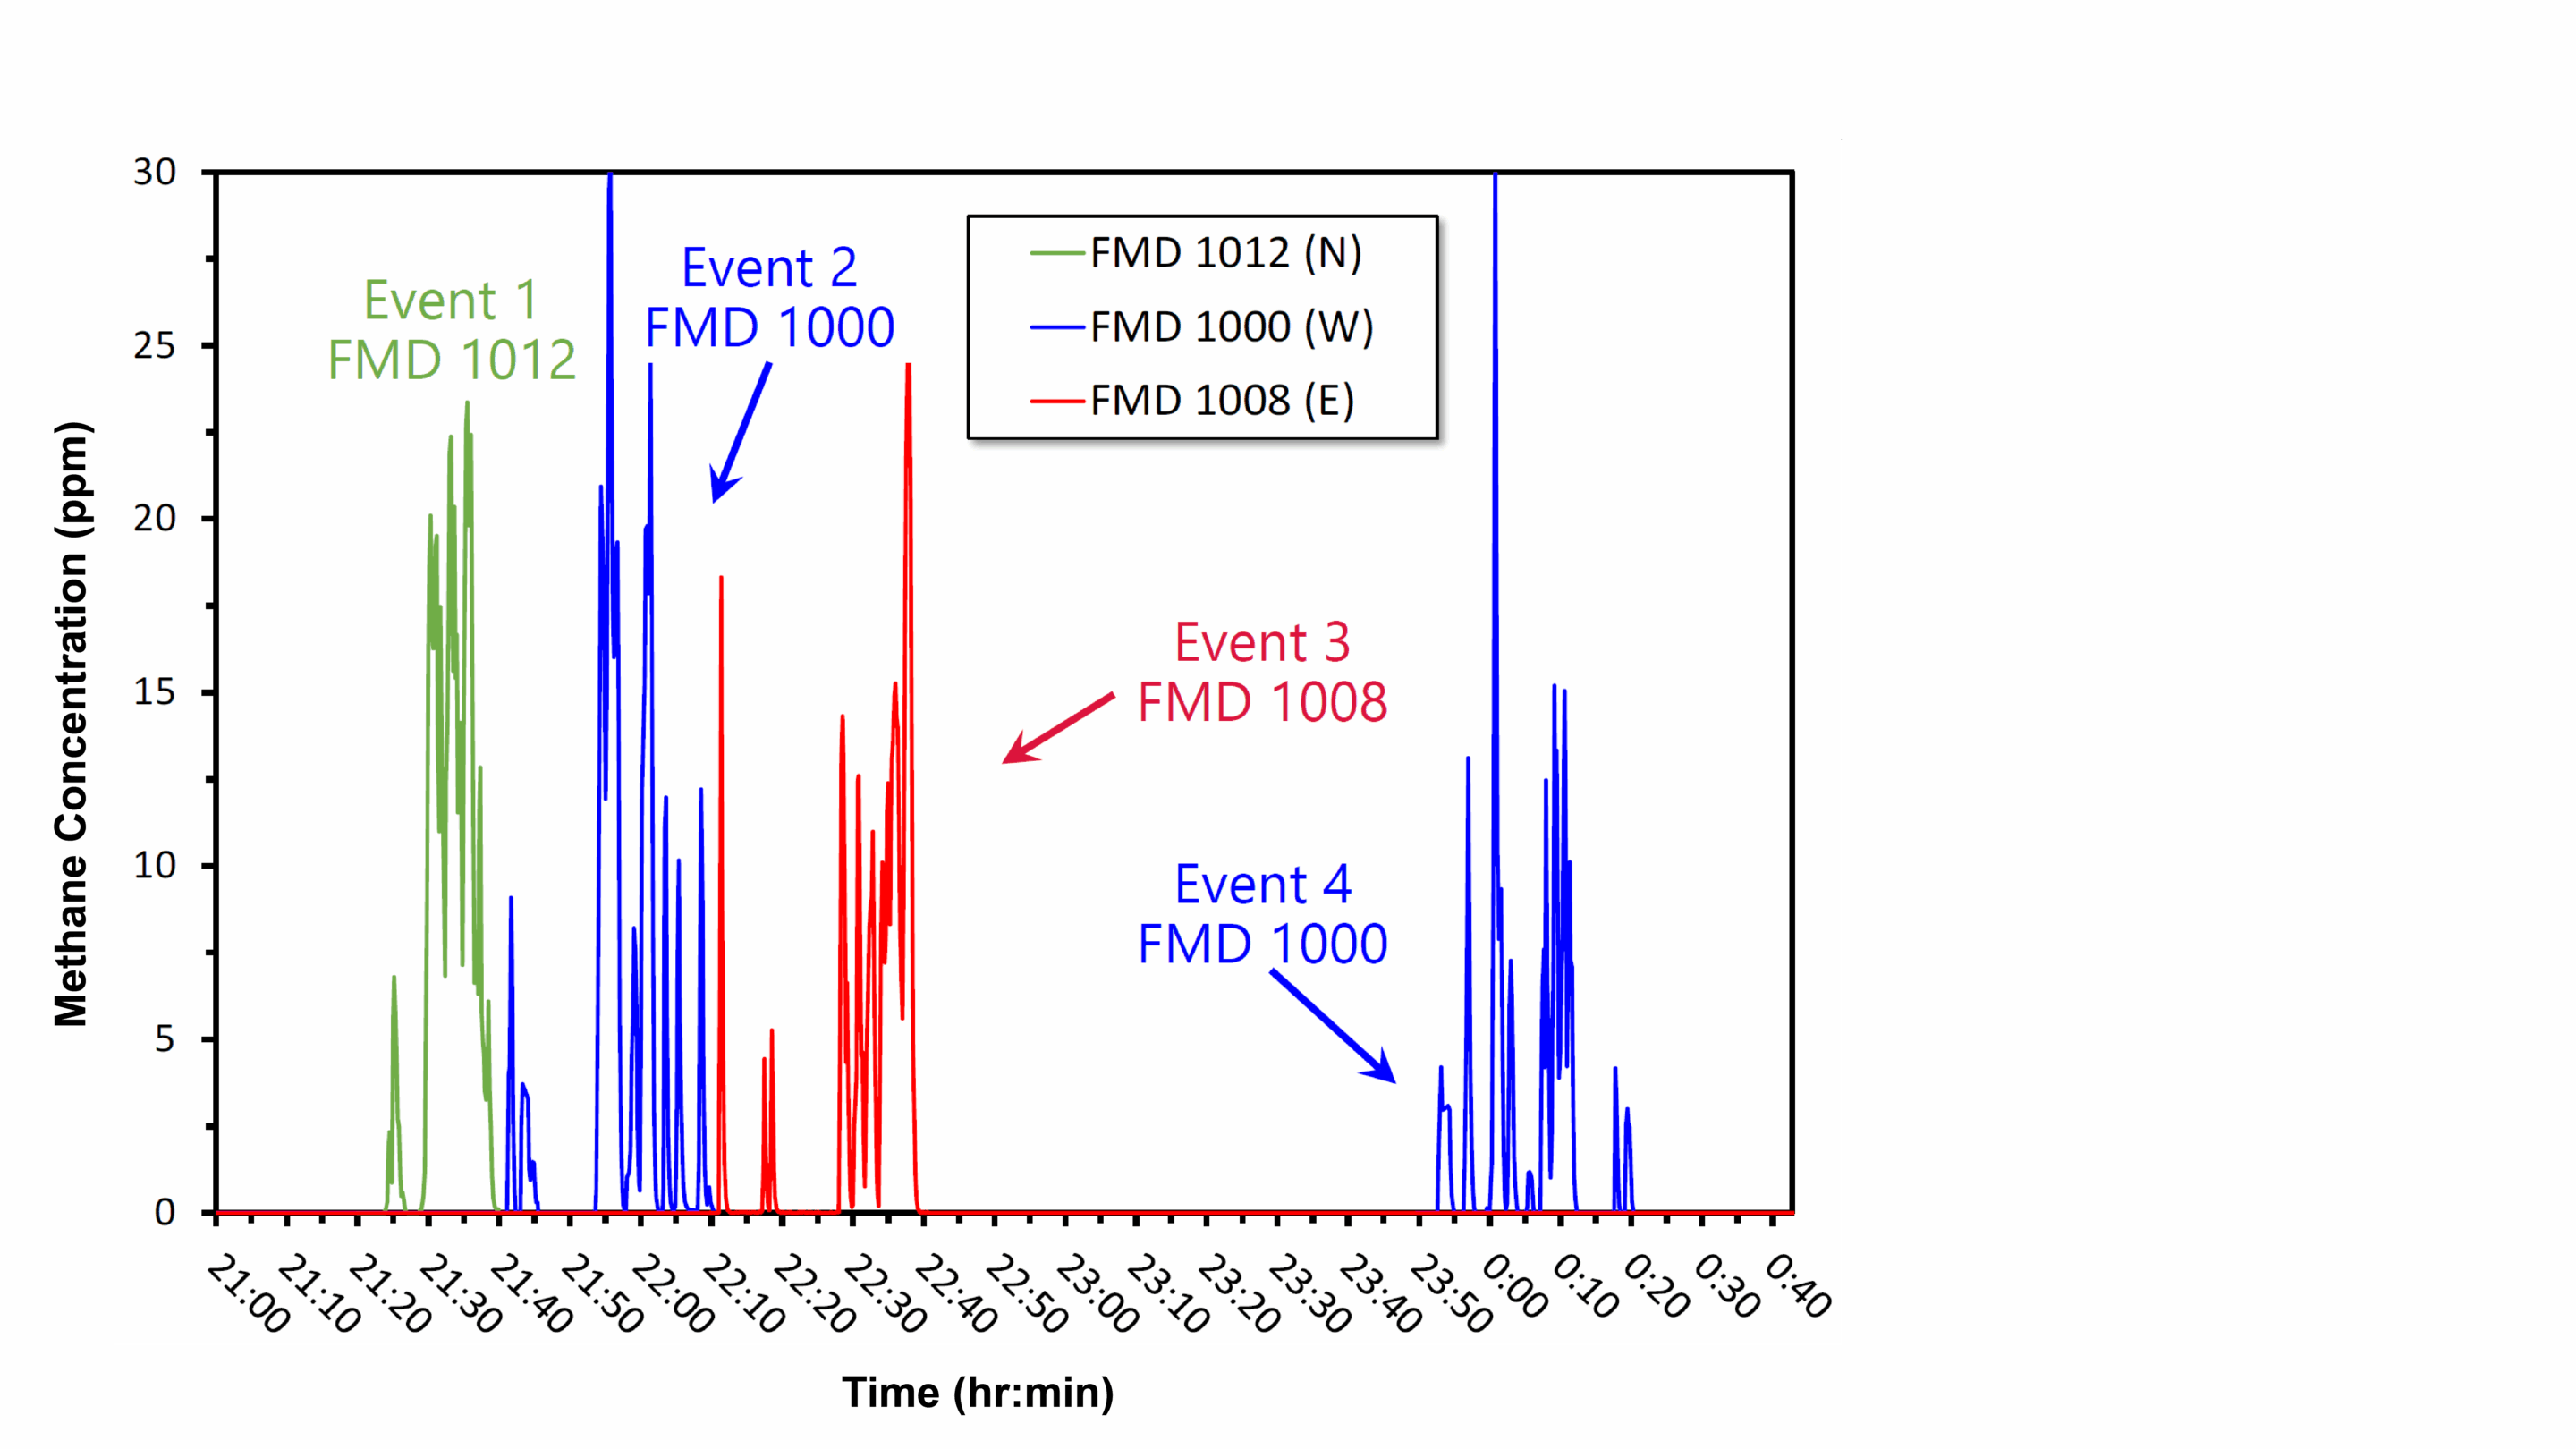
Measured Concentrations for Quantification Trials
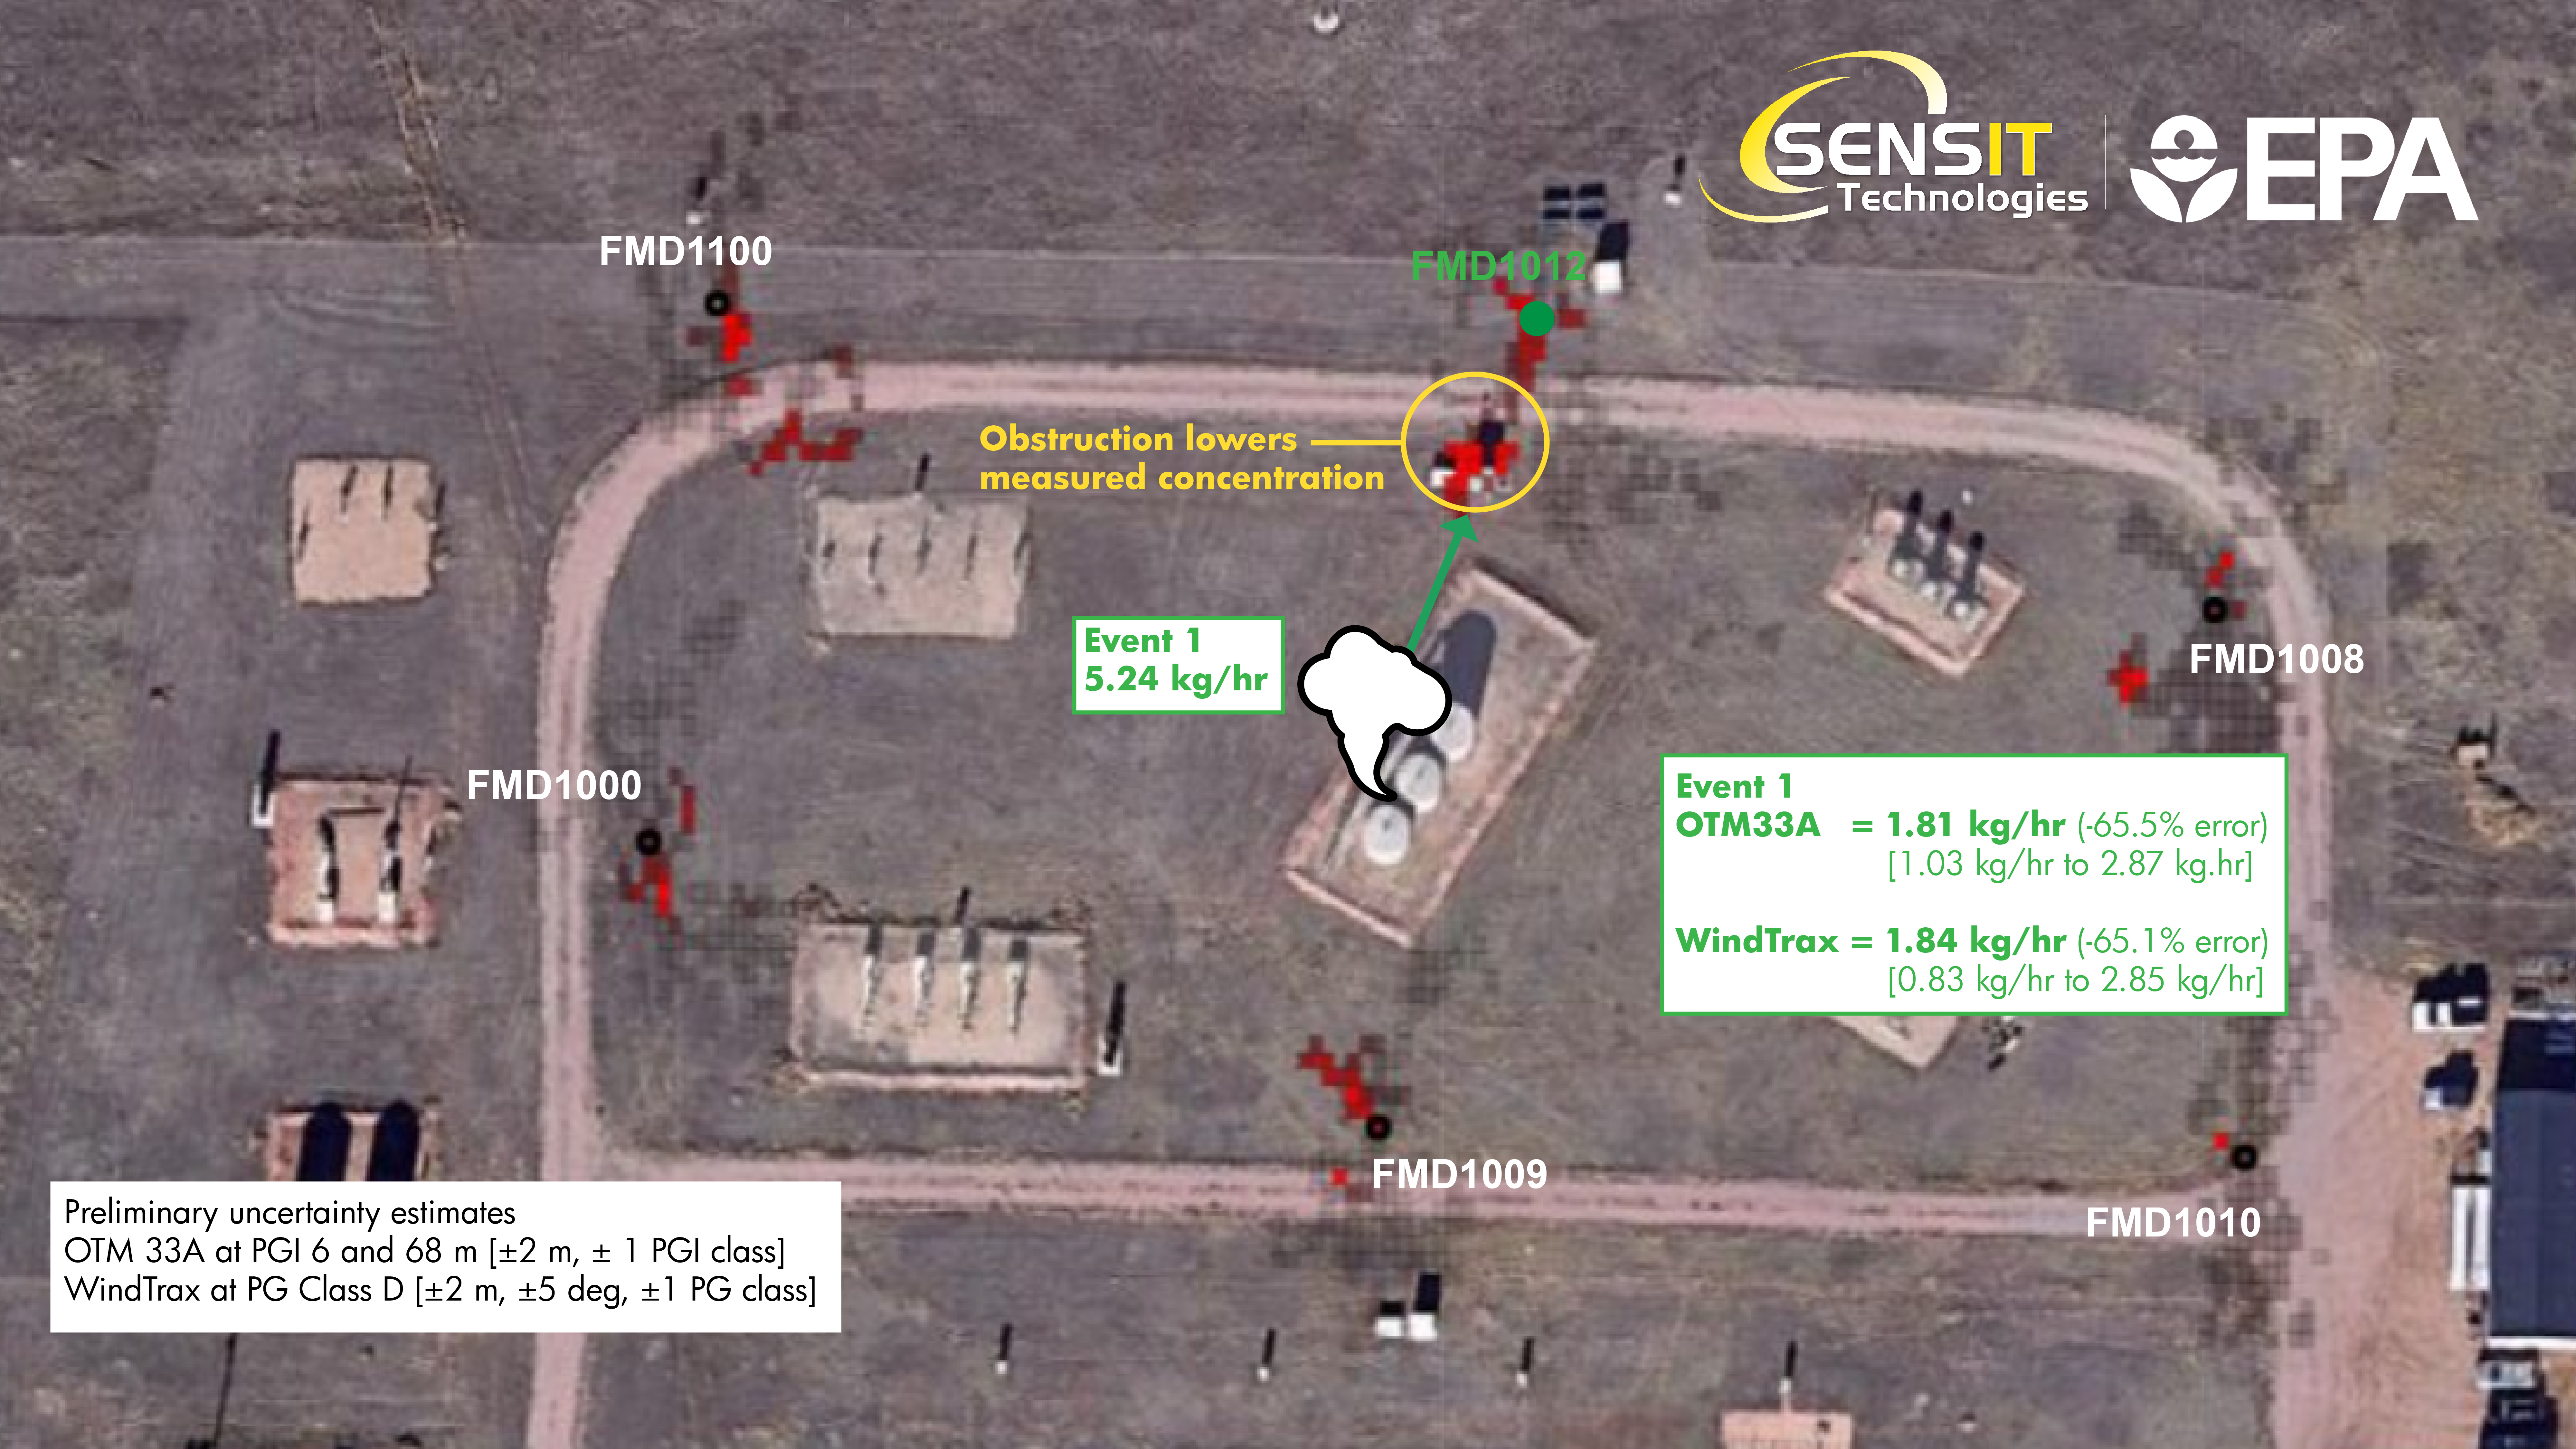
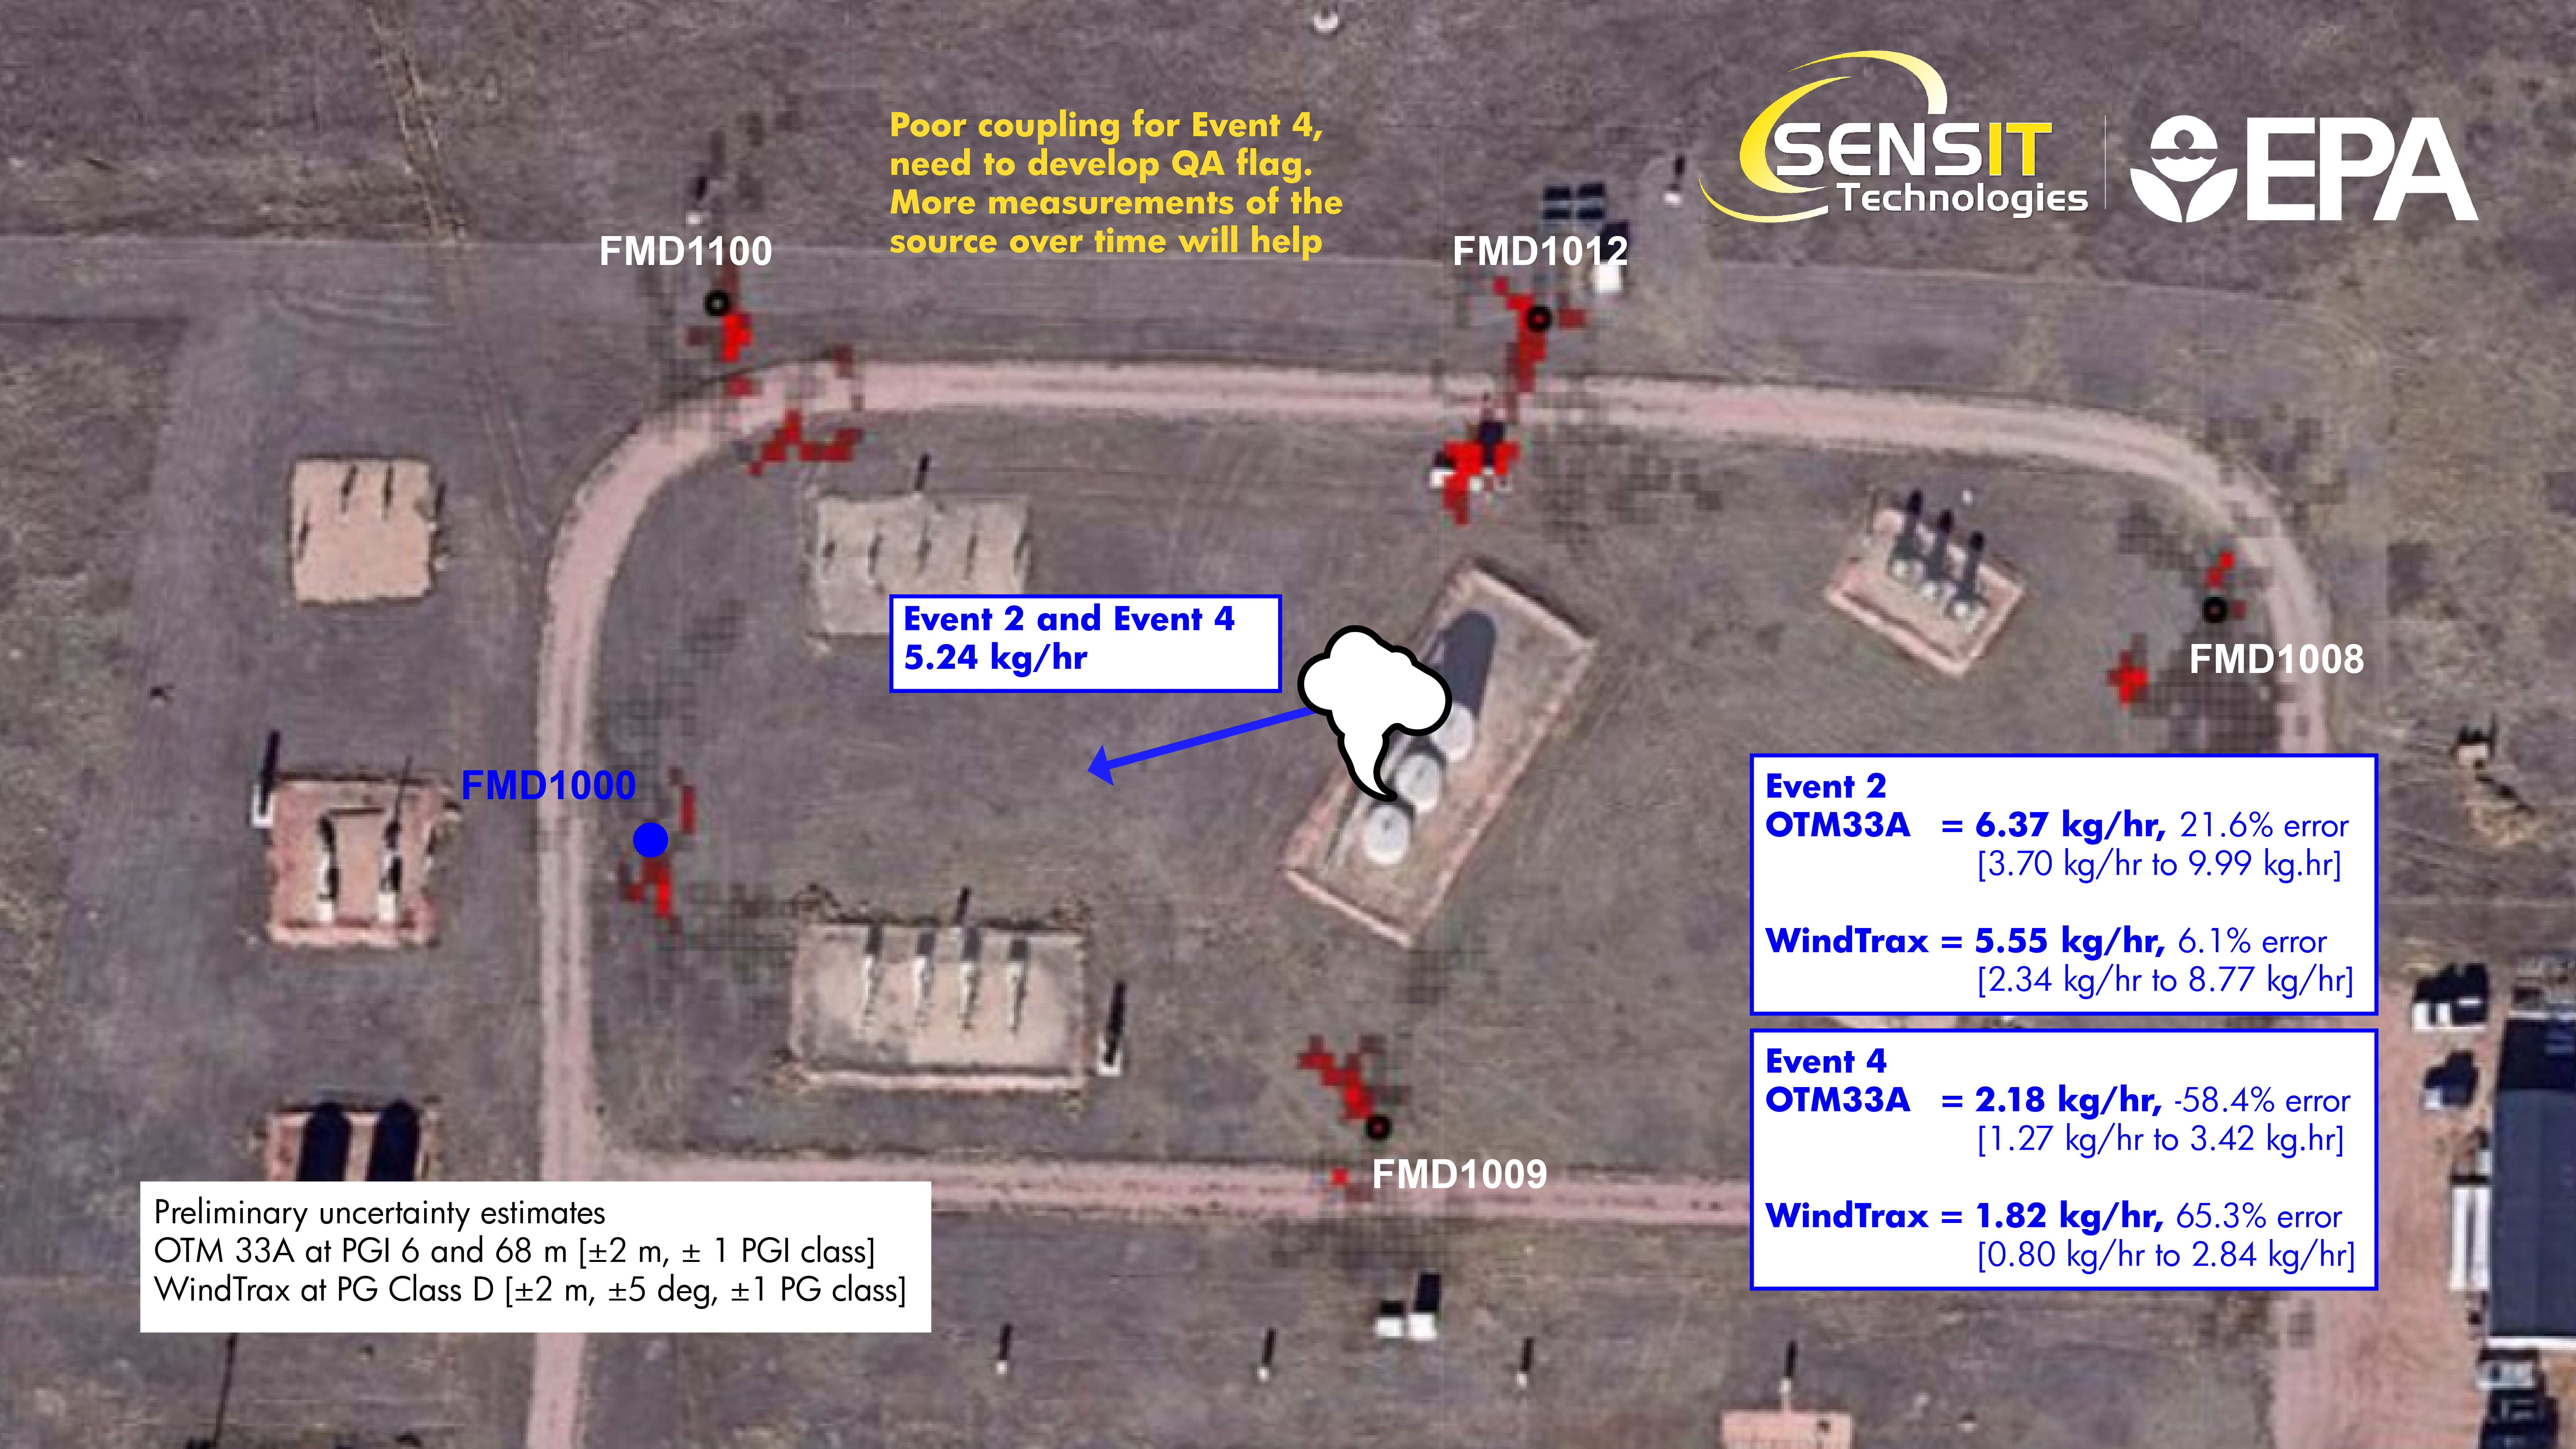
Quantification by:
OTM 33A1 simple emission estimate
Q =2π*u*c*σyσz
Where:
u=mean wind speed (max bin)
c=mean max bin concentration (kg/m3)
Open-source WindTrax™ backwards Lagrangian stochastic (bLs) model with inputs from OTM 33A binning.
Known source location (4T-1)
Conclusions
Open collaboration leads to better understanding of the data and greater transparency
SENSIT FMD is for capturing plume-probe overlap within process units and at the fence line.
Deployment at METEC was able to identify and localize leaks.
Freeware modeling packages capable of providing approximate estimates of leak rates.
- Be careful of model assumptions - know when they aren't applicable
Work on this data set continues!

